Orbital data centers, by the numbers
In November 2025, a refrigerator-sized satellite called Starcloud-1 carried an NVIDIA H100 into low Earth orbit and, a few weeks later, became the first machine to train a small language model in space. That same month, Google published Project Suncatcher, a design for a constellation of solar-powered satellites running its TPUs, networked by lasers. By March 2026, the Economist asked whether data centers in space are “less crazy than you think.”
The pitch is easy to like. In the right orbit a solar panel sees the sun almost continuously and, by Google’s estimate for Suncatcher, collects up to eight times the annual energy of one on the ground. There are no land permits to win and no cooling water to evaporate. Once the array is built the electricity is free, and electricity is what terrestrial data centers increasingly compete for.
Is it real, or is it a press release? I built an open-source model to work it out by running
the numbers, with every assumption written down and sourced. The model is
spacedc-mdao (project writeup
here), and you can run it in your browser.
This post is what it reports, and why one input most readers have never considered decides most
of the result.
Where the bottleneck actually is
A natural guess for what limits a data center in orbit is communication: satellites are far away, and bandwidth is scarce. That guess is partly right, but it points at the wrong link.
In this model, the satellite-to-satellite links are not where the constraint binds. Free-space optical links between nearby satellites carry a lot through a small aperture: the model reproduces about 12.8 terabits per second through a single 10-centimeter aperture for a Suncatcher-style cluster in tight formation, using off-the-shelf wavelength-division optics, and Google has demonstrated 1.6 Tbps (800 Gbps each way) on a bench link toward that target. The catch is that the tight formation flying and precision pointing these links need are themselves unproven at this scale, and Google calls them a primary open challenge. Assume they work, and bandwidth inside the constellation is well within reach.
The hard link is the last one: getting results down to Earth, through weather and a small number of ground stations. How much you need to send down depends on what the data center is computing, and that single quantity swings the economics by a factor of four. The rest of this post builds on the one idea the model is organized around.
Delivered compute
A GPU’s datasheet lists a peak number: so many trillion operations per second. No data center ever delivers that. The peak gets chipped away by every real constraint between the silicon and the customer, and what is left is what you can sell.
The model treats this as a product of factors, each between 0 and 1:
delivered = peak × f_software × f_power × f_thermal × f_network × f_availability × f_utilizationEach factor is the fraction of compute that survives one discipline. Multiplied together they usually land well below peak. For the baseline text-inference design in orbit, the chain delivers about 29% of nominal. The terrestrial baseline, running the same GPUs, keeps about 47%. Orbit is behind before any cost is counted, because power, heat, network, and reliability each take a cut.
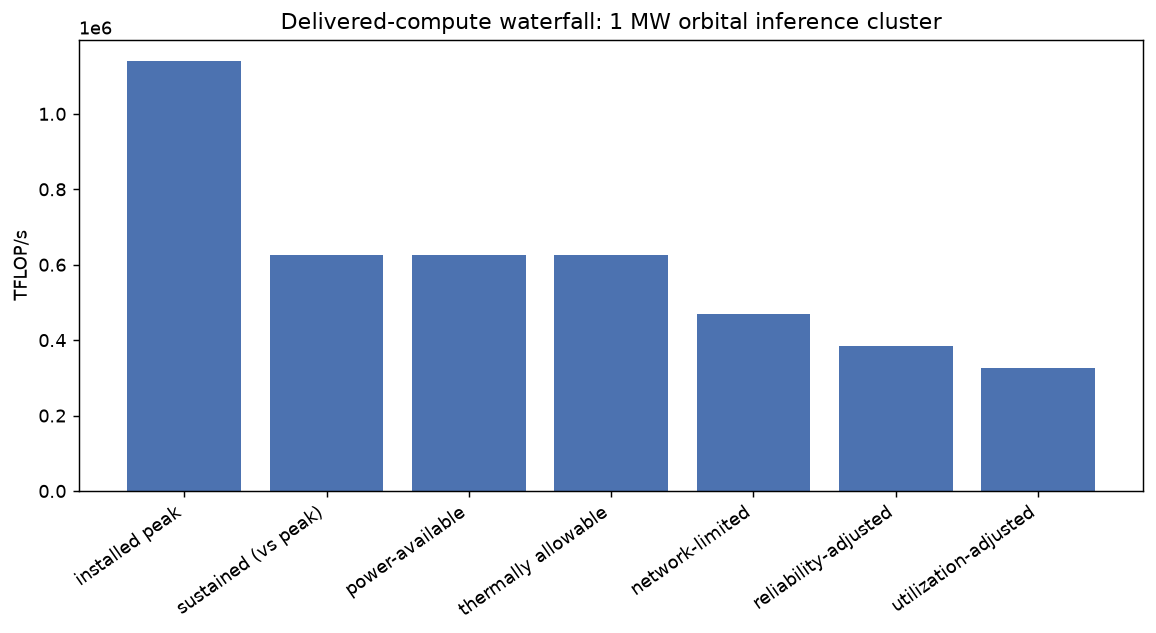
Installed peak compute, degraded step by step by power, heat, network, and reliability into the ~29% you can sell.
The point of the picture is that you cannot reason about one constraint at a time. The factor that fails first, the binding constraint, is the one that matters, and it changes with the design. The model keeps power and heat as separate gates: a power budget that closes does not mean the thermal budget closes.
Rejecting heat in vacuum
On the ground, you reject waste heat into air or water. In vacuum, the only way out is to radiate it as infrared, and radiated power scales with surface area and the fourth power of temperature. That makes radiators big and heavy.
After it absorbs sunlight, Earth’s albedo, and Earth’s own infrared glow, a panel near room temperature nets on the order of 600 watts per square meter. The model reproduces the roughly 633 W/m² net figure Starcloud published from that balance; the gross two-sided emission is higher, around 830 W/m². A megawatt of waste heat therefore needs hundreds to thousands of square meters of deployable panel. In the bundled design that works out to about 18 kilograms of thermal hardware per kilowatt of compute, and every kilogram is launch cost.
The first component to overheat is usually the stacked high-bandwidth memory beside the processor, which tolerates less heat than the die. In the model’s H100 design the radiator runs cool enough to protect that memory rather than the GPU core, which makes it larger and heavier than a “cool the chip” estimate would suggest. NVIDIA publishes some H100 thermal specs but not the full junction-to-coolant limits this radiator model needs, so it works from about 393 K for the die (near the widely cited ~120 °C throttle) and about 368 K for the more heat-sensitive memory. Those setpoints carry real uncertainty, and they size the radiator.
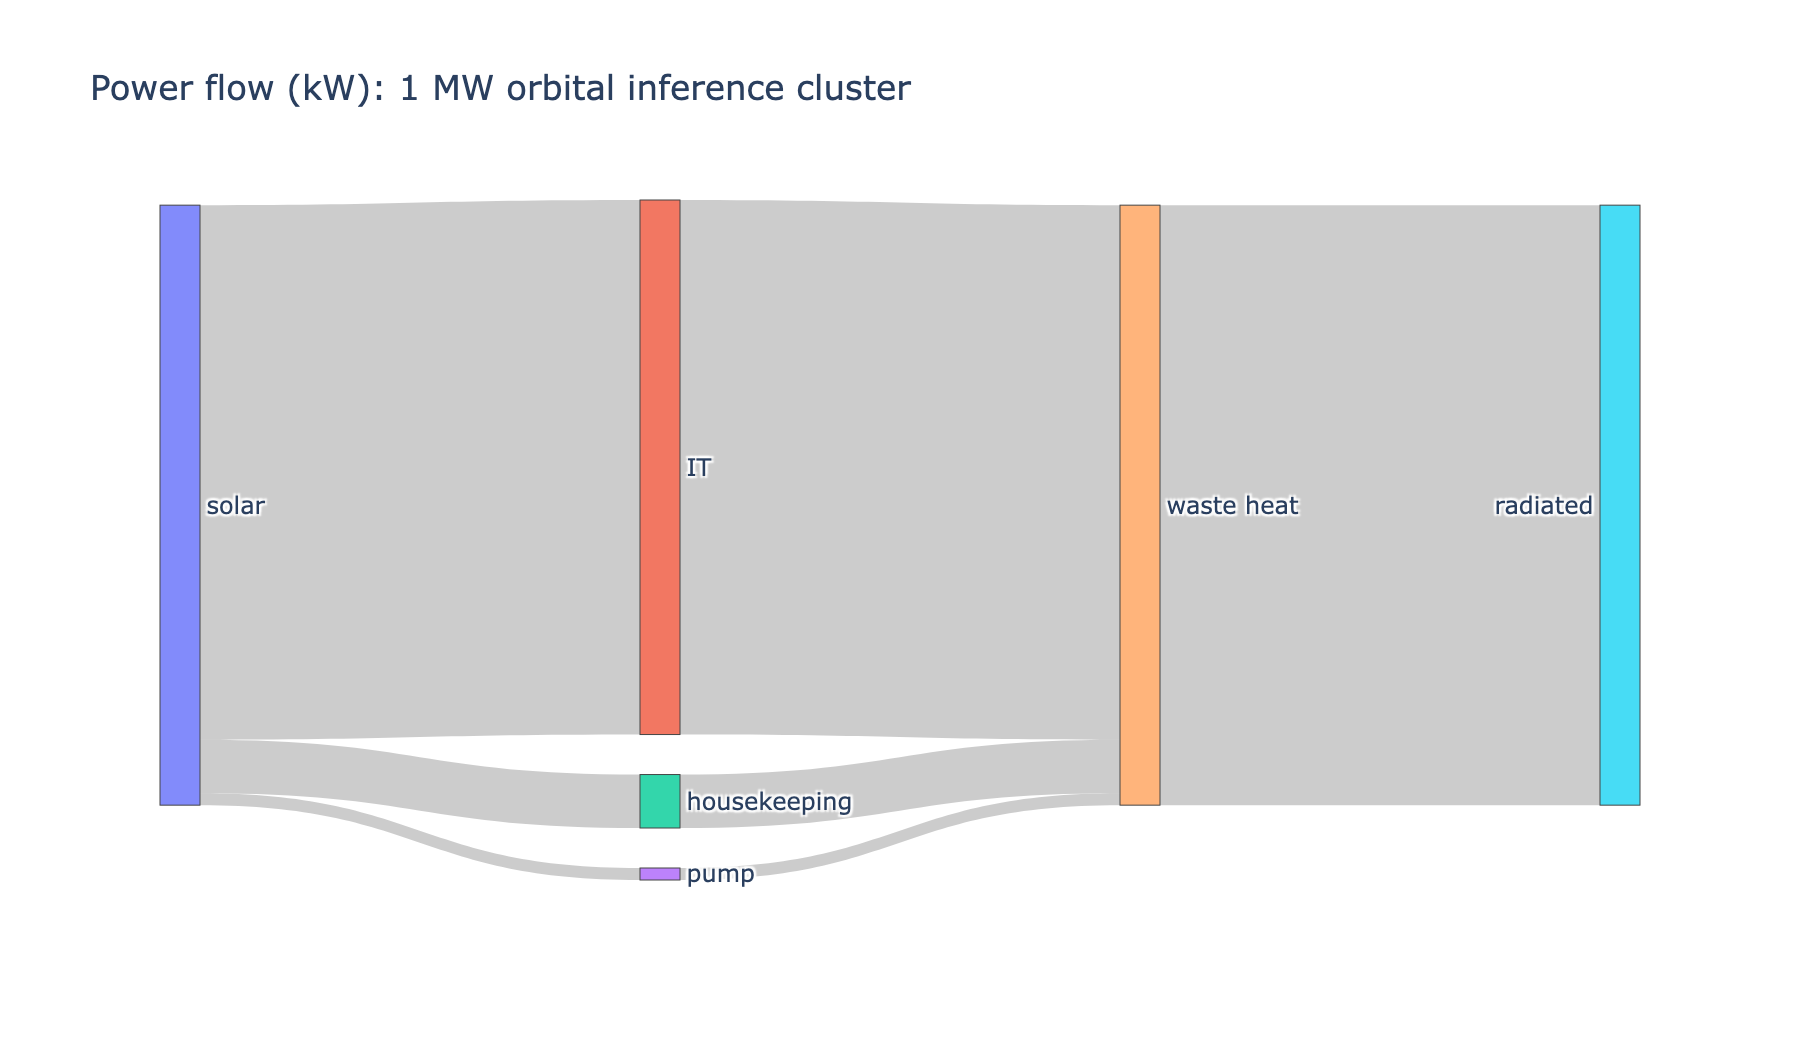
Where the power goes: solar in; accelerators, housekeeping, and the coolant pump out; waste heat rejected through the radiator.
Bits per FLOP
This is the input that moves the result more than any other, and it rarely gets named: how many bits the accelerator must ship per floating-point operation it performs.
Text inference is light. A token is about 32 bits and costs roughly twice the model’s parameter count in operations, which works out to about 1e-8 bits per FLOP. At that rate the downlink is nearly idle, and the binding constraint is weather, because an optical ground link from a single site is clear only about 75% of the time, a site-dependent figure that ground-station diversity improves. Run that case and orbit costs about $1,237 per delivered PFLOP-day against $66 on the ground, roughly 19 times more expensive.
Now ship something richer, such as image generation or embeddings, and the data per operation jumps a hundredfold or more, to about 2e-6 bits per FLOP. The downlink goes from idle to saturated, the binding constraint shifts from weather to raw bandwidth, delivered compute collapses to about 7% of peak, and the cost climbs to about $5,389 per PFLOP-day, roughly 82 times Earth.
The satellites, orbit, and GPUs are identical in both cases. Only the workload changed, and it moved the result by about 4x. Both bits-per-FLOP figures are low-confidence estimates, which is exactly why the model exposes them as inputs you can change. Communication intensity dominates the levelized cost by a wide margin, which is why the sensitivity analysis matters more than any single headline number.
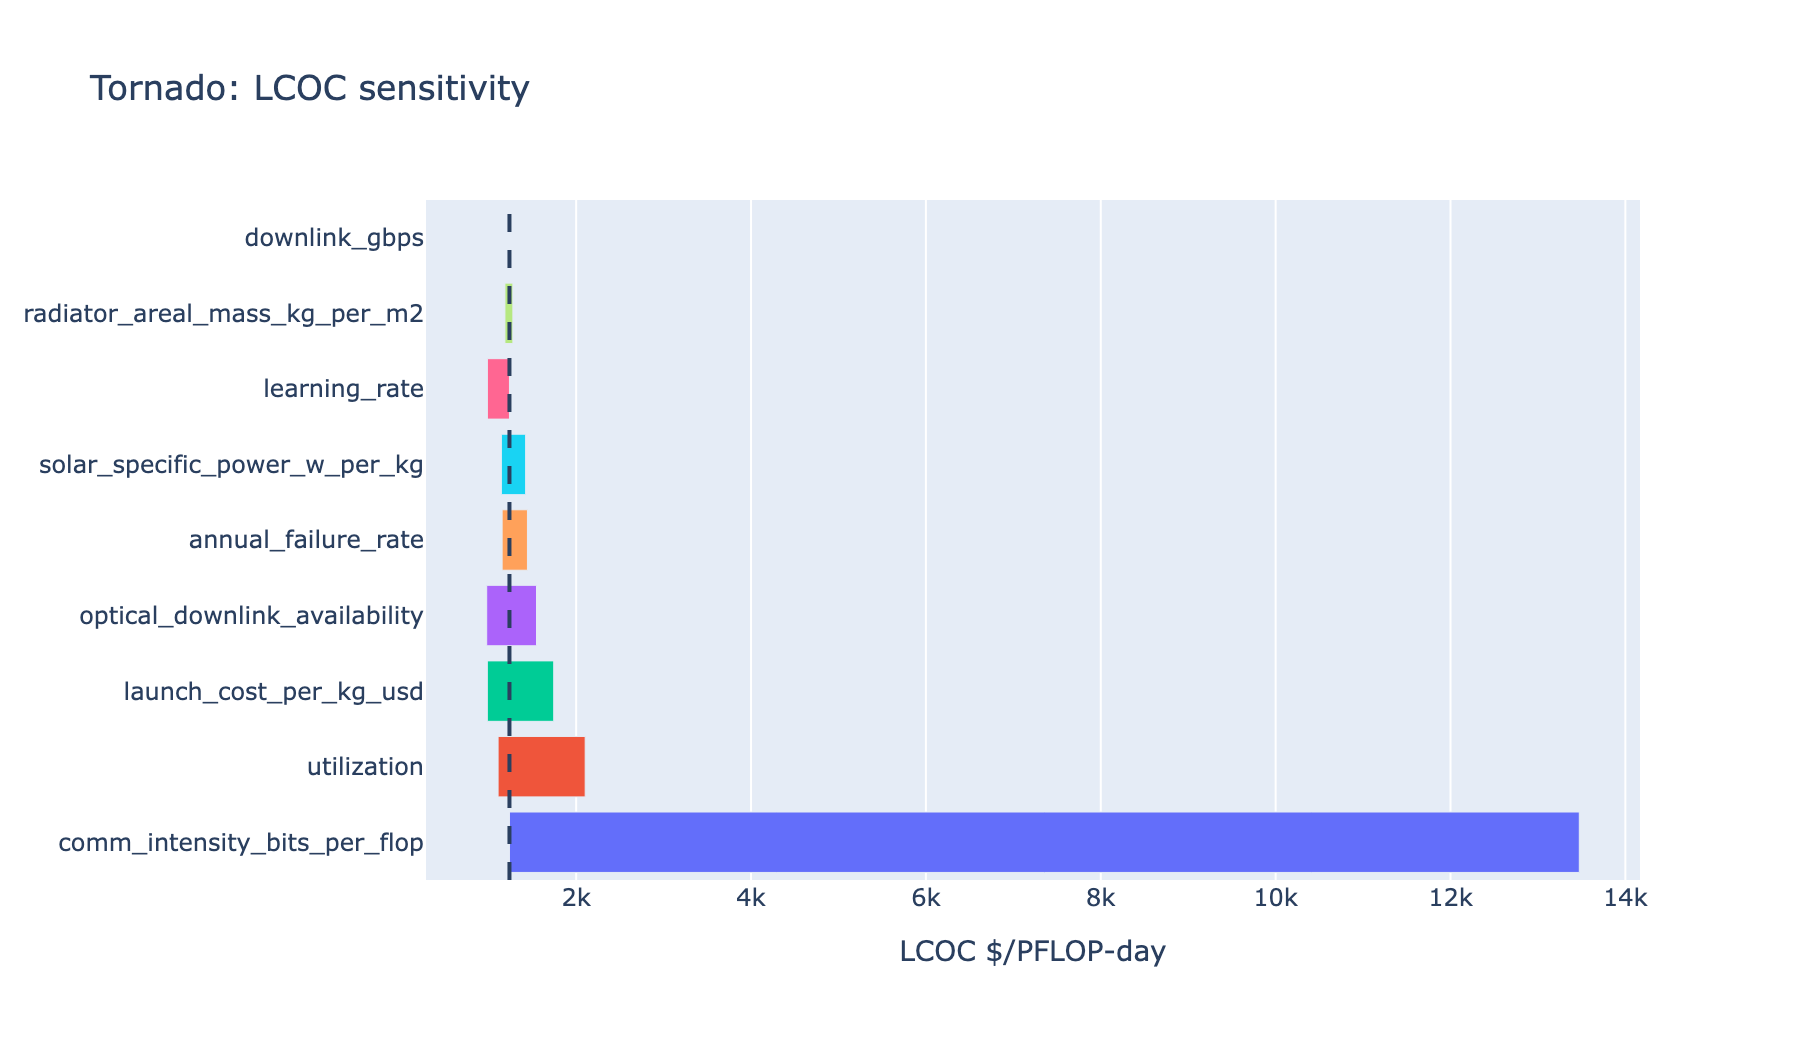
Communication intensity dominates levelized-cost sensitivity, ahead of satellite cost and launch price.
What would have to be true
The 19x gap is the sum of several assumptions rather than a law of physics, and optimists expect each assumption to improve. The model lets you improve all of them at once. Starting from the text-inference baseline and stacking every optimistic lever:
| Change | LCOC ($/PFLOP-day) | vs Earth |
|---|---|---|
| Baseline (text inference) | 1,237 | 19x |
| Add ground-station diversity (75% → 95% link availability) | 977 | 15x |
| Cheaper launch ($1,500 → $200/kg) | 604 | 9x |
| Production learning on unit cost | 404 | 6x |
| Lighter solar (100 → 200 W/kg) | 400 | 6x |
| Lighter radiators (7 → 2 kg/m²) | 396 | 6x |
| Higher utilization (85% → 98%) | 344 | 5x |
| Lower failure rate (5% → 1% per year) | 311 | 5x |
Stacking everything reaches about 5x Earth, still short of parity. When all of those assumptions vary together across their plausible ranges, the model runs 500 Monte-Carlo trials, and orbit beats Earth in zero of them for this workload.
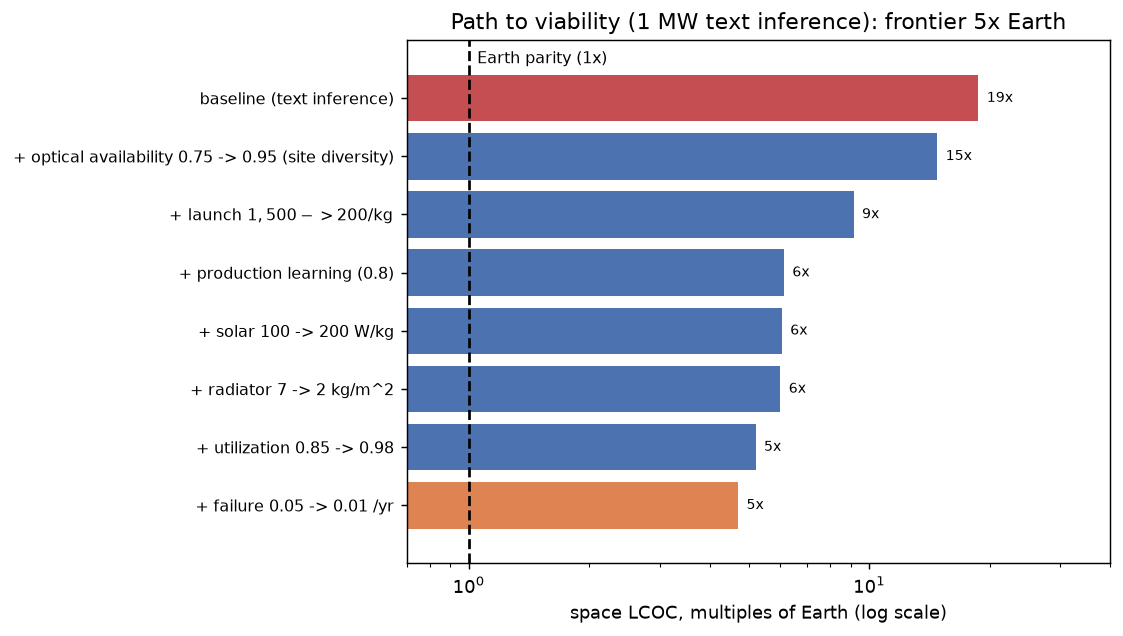
Stacking every optimistic lever moves the text-inference design from about 19x toward about 5x Earth, still short of parity.
This does not show that orbit is hopeless. It shows which numbers have to hold, and two of them are not yet demonstrated: a satellite cheap enough to build, and a workload light enough on the downlink.
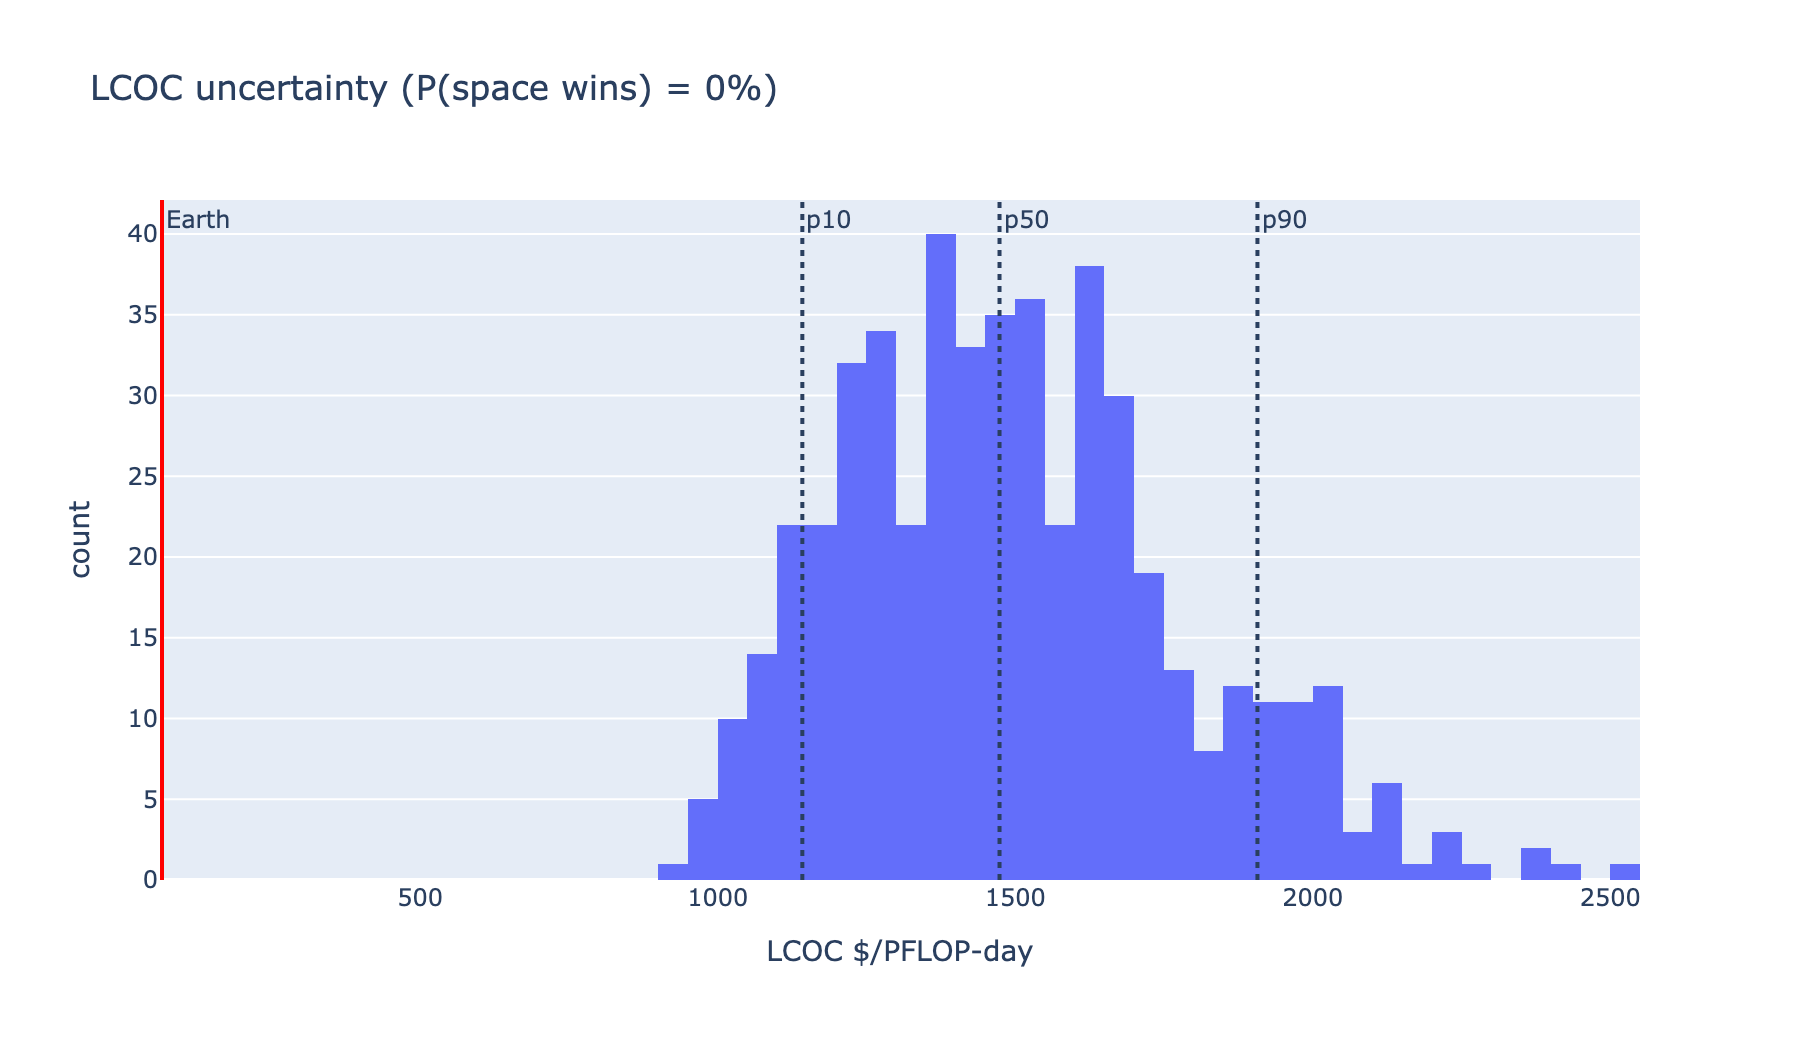
Levelized cost under joint input uncertainty: the model stays above the Earth baseline for this workload across every draw.
Reconciling the optimistic estimates
If the model says 19x and stretches to 5x, why are there near-parity claims? The most-cited one comes from Andrew McCalip, an engineer at the space-manufacturing company Varda, whose calculator the Economist featured. The gap between his answer and mine comes down to what you measure and where you set the sliders. The physics is not in dispute.
McCalip’s calculator compares capacity capex: dollars per watt of capacity built, with the GPUs excluded because they cost the same in both places. My model agrees with him there. The terrestrial figure of about $12 per watt, roughly $12 billion per gigawatt, lands on his $15.9 billion-per-gigawatt estimate. That agreement is a useful check that the cost model is calibrated against an independent number.
The divergence is that capex per watt stops at the hardware. The headline figure here, levelized cost of delivered compute, keeps going and charges for the whole delivered-compute waterfall: the heat you could not reject, the bits you could not get down, the GPUs that failed. Feed the model McCalip’s own optimistic sliders, with cheap launch, a light radiator, and a crosslink-only architecture, and the capacity capex does fall by about 2.5x, to about $212 per watt. The levelized cost still stays around 6x Earth, because the waterfall is physics and does not care how cheap the bus was.
McCalip’s own conclusion is more careful than the headlines built on it: “The physics doesn’t immediately kill it, but the economics are savage.” That is roughly where this model lands too. The lever everyone agrees on is launch: a fully reusable Starship reaching $200/kg, a mid-2030s target rather than a current price, would cut the launch share of cost from about $236 to about $11 per watt. The model’s $1,500/kg current baseline is already generous to orbit: dedicated Falcon 9 lists nearer $3,000/kg and a small satellite on rideshare pays more still, so honest current pricing would widen the starting gap. The lever no one has demonstrated is a sub-$5/watt AI satellite. The costed power system alone, with space-grade solar at $50 to $60 per watt, keeps the model’s satellite near $200/watt.
Change the assumptions yourself
The point of building this as an open model is that you do not have to trust my sliders. You can move them.
The interactive app runs in a browser with no install. Change launch cost, solar specific power, radiator mass, utilization, failure rate, or the bits-per-FLOP input, and the waterfall, the binding constraint, and the cost recompute live. A provenance tab shows the source, date, and confidence behind every default, so you can see which numbers are measured, which are vendor claims, and which are projections.
Or run it yourself:
pip install spacedc-mdao

# text inference: the ~19x headline
orbitdc compare examples/scenarios/orbital_1mw_inference.yaml \
  examples/scenarios/earth_hyperscale_baseline.yaml --tornado

# rich-output multimodal: the downlink-bound ~82x case
orbitdc compare examples/scenarios/orbital_multimodal_inference.yaml \
  examples/scenarios/earth_hyperscale_baseline.yaml

# every optimistic slider at once: ~6x
orbitdc compare examples/scenarios/orbital_mccalip_optimistic.yaml \
  examples/scenarios/earth_hyperscale_baseline.yaml
Data centers in space are real engineering, and they are not commercially ready today. They sit on a feasibility boundary set by a short list of numbers: launch price, satellite cost, radiator mass, failure rate, and how much each workload has to send to Earth. What the model offers is a transparent map of that boundary that anyone can probe. If you think one of these numbers is wrong, the model is open, and I would like to know.
The model, the assumptions, and a downloadable technical primer are on GitHub. Numbers are for a 1 MW-class design against a best-in-class hyperscale baseline (PUE 1.10) and are illustrative of the method rather than a scorecard for any one company.
This is an independent analysis I did on my own time, using the public sources cited above. The views are my own and do not represent any current or former employer.
More in Modeling & simulation
- sysml2kit 0.4.0: multi-fidelity verification on a compute budget · 2026-08-21
- Track accuracy is an aperture decision · 2026-08-18
- Power-aperture, and the heat it hides · 2026-08-13