Tracing a local LLM agent end to end: Strands Agents, Ollama, and OpenTelemetry
Most agent tutorials end when the agent prints an answer. That leaves the questions that matter unanswered. Did it call the tools, or answer from its priors? What context did retrieval hand it? Which step ate the latency? When the answer is wrong, where did the reasoning go off?
Almost all published guidance on agent observability assumes a vendor backend: Langfuse cloud, LangSmith, CloudWatch, Datadog. This walkthrough takes the other path. Strands Agents plus Ollama for a fully local agent, OpenTelemetry for instrumentation, and Jaeger or Grafana in a single Docker container as the backend. Everything runs on your machine; nothing needs an API key.
The demo agent, BrewTrace, diagnoses pour-over coffee. Given “16g/250g V60, 94°C, 3:45 drawdown, sour and thin,” it should recommend one controlled change (grind finer), and the trace should prove how it got there. Coffee is the vehicle; the payload is the observability pattern.
Tools are pure functions
The design rule that makes everything else work: all domain logic is pure, typed, LLM-free Python, and agent tools are thin wrappers.
# tools/brew_math.py — pure function on top
def assess_drawdown(drawdown_s: int, method: BrewMethod) -> Literal[...]:
    low, high = DRAWDOWN_TARGETS_S[method]
    ...

# thin @tool wrapper at the bottom of the same file
@tool
def assess_drawdown_time(drawdown_s: int, method: str) -> dict:
    """Assess whether a pour-over drawdown time is fast, in range, slow, or stalled.

    Args:
        drawdown_s: Drawdown time in seconds
        method: Brew method, one of: v60, kalita, clever
    """
    ...
Strands builds the tool schema from the signature, type hints, and docstring: the first
paragraph becomes the tool description, and the Args: section becomes per-parameter
descriptions. The model is the docstring’s real audience, so write for it.
Because the logic is pure, pytest exercises the entire diagnosis rule table (grind before
temperature before ratio, one variable per brew, guards for interactions like “sour but stalled
drawdown must not get a finer grind”) without a model, a container, or a network call. The
agent’s only job is routing, and routing is exactly what a trace makes visible.
The agent
from strands import Agent
from strands.models.ollama import OllamaModel

model = OllamaModel(host="http://localhost:11434", model_id="qwen3",
                    temperature=0.2, keep_alive="10m")
agent = Agent(model=model, system_prompt=SYSTEM_PROMPT, callback_handler=None,
              tools=[calculate_brew_ratio, assess_drawdown_time,
                     retrieve_recipe_notes, recommend_adjustment, ...])
Two findings from building this that the Strands docs won’t tell you:
1. Model choice dominates tool-calling reliability. qwen3 (8B) walks the four-tool workflow essentially every time. llama3.1-8B, the model most tutorials reach for, calls a tool when you name one explicitly, but on an open-ended “diagnose this brew” prompt it skips the tools and answers from its own coffee knowledge, even with a system prompt that forbids exactly that. The eval harness quantifies this instead of hand-waving it (see below).
2. Forced structured output fails at the end of tool loops. Strands supports
agent(prompt, structured_output_model=BrewAdvice), which forces a final schema-shaped tool
call. Small local models fail that forcing routinely once the context contains a long tool
conversation. The fix is two passes: let the tool-using agent answer in prose, then run a second
tool-free agent whose only job is extracting the structured object from that answer. One extra
short LLM call, near-100% reliability, and the extraction shows up in the trace as its own small
span.
Wiring OpenTelemetry
Strands ships its instrumentation behind one setup call:
from strands.telemetry import StrandsTelemetry

os.environ.setdefault("OTEL_EXPORTER_OTLP_ENDPOINT", "http://localhost:4318")
os.environ.setdefault("OTEL_SERVICE_NAME", "brewtrace")
StrandsTelemetry().setup_otlp_exporter()
The backend is one container. Jaeger v2 is built on the OpenTelemetry Collector, so it ingests OTLP directly on 4317/4318. If you have seen older tutorials with a separate otel-collector service in docker-compose, that layer is gone:
services:
  jaeger:
    image: jaegertracing/jaeger:2.19.0
    ports: ["16686:16686", "4317:4317", "4318:4318"]
Strands now emits spans for the agent invocation, each event-loop cycle, each model call (with token counts and time-to-first-token), and each tool execution (with the tool’s schema and arguments). What it can’t know is your domain. For that, BrewTrace opens a manual parent span and stamps it with the parsed brew:
with tracer.start_as_current_span("brewtrace.request") as span:
    span.set_attributes({
        "brew.method": "v60", "brew.dose_g": 16, "brew.water_g": 250,
        "brew.ratio": 15.62, "brew.temperature_c": 94,
        "brew.drawdown_seconds": 225, "taste.primary_defect": "sour_thin",
    })
    advice, result = run_diagnosis(agent, brew_text)
Two details worth copying:
- The attributes come from a deterministic regex parser that runs before the agent. Traces
stay queryable no matter what the model does; you can search
taste.primary_defect=sour_thinin Jaeger even for runs where the model ignored the defect entirely. - Custom attributes get their own namespaces (
brew.*,taste.*,eval.*). OTel naming guidance is explicit: never extend a reserved namespace likegen_ai.*, because a future spec revision can claim the name.
The Strands spans nest under the manual span automatically, since both use the global tracer provider. The result in Jaeger:
brewtrace.request                              55.2s
└── invoke_agent Strands Agents                43.2s   gen_ai.request.model=qwen3
    ├── execute_event_loop_cycle               35.2s
    │   ├── chat                               35.2s   842 in / 1363 out tokens
    │   ├── execute_tool calculate_brew_ratio    6ms
    │   ├── execute_tool assess_drawdown_time
    │   ├── execute_tool retrieve_recipe_notes
    │   └── execute_tool recommend_adjustment
    └── execute_event_loop_cycle                       final answer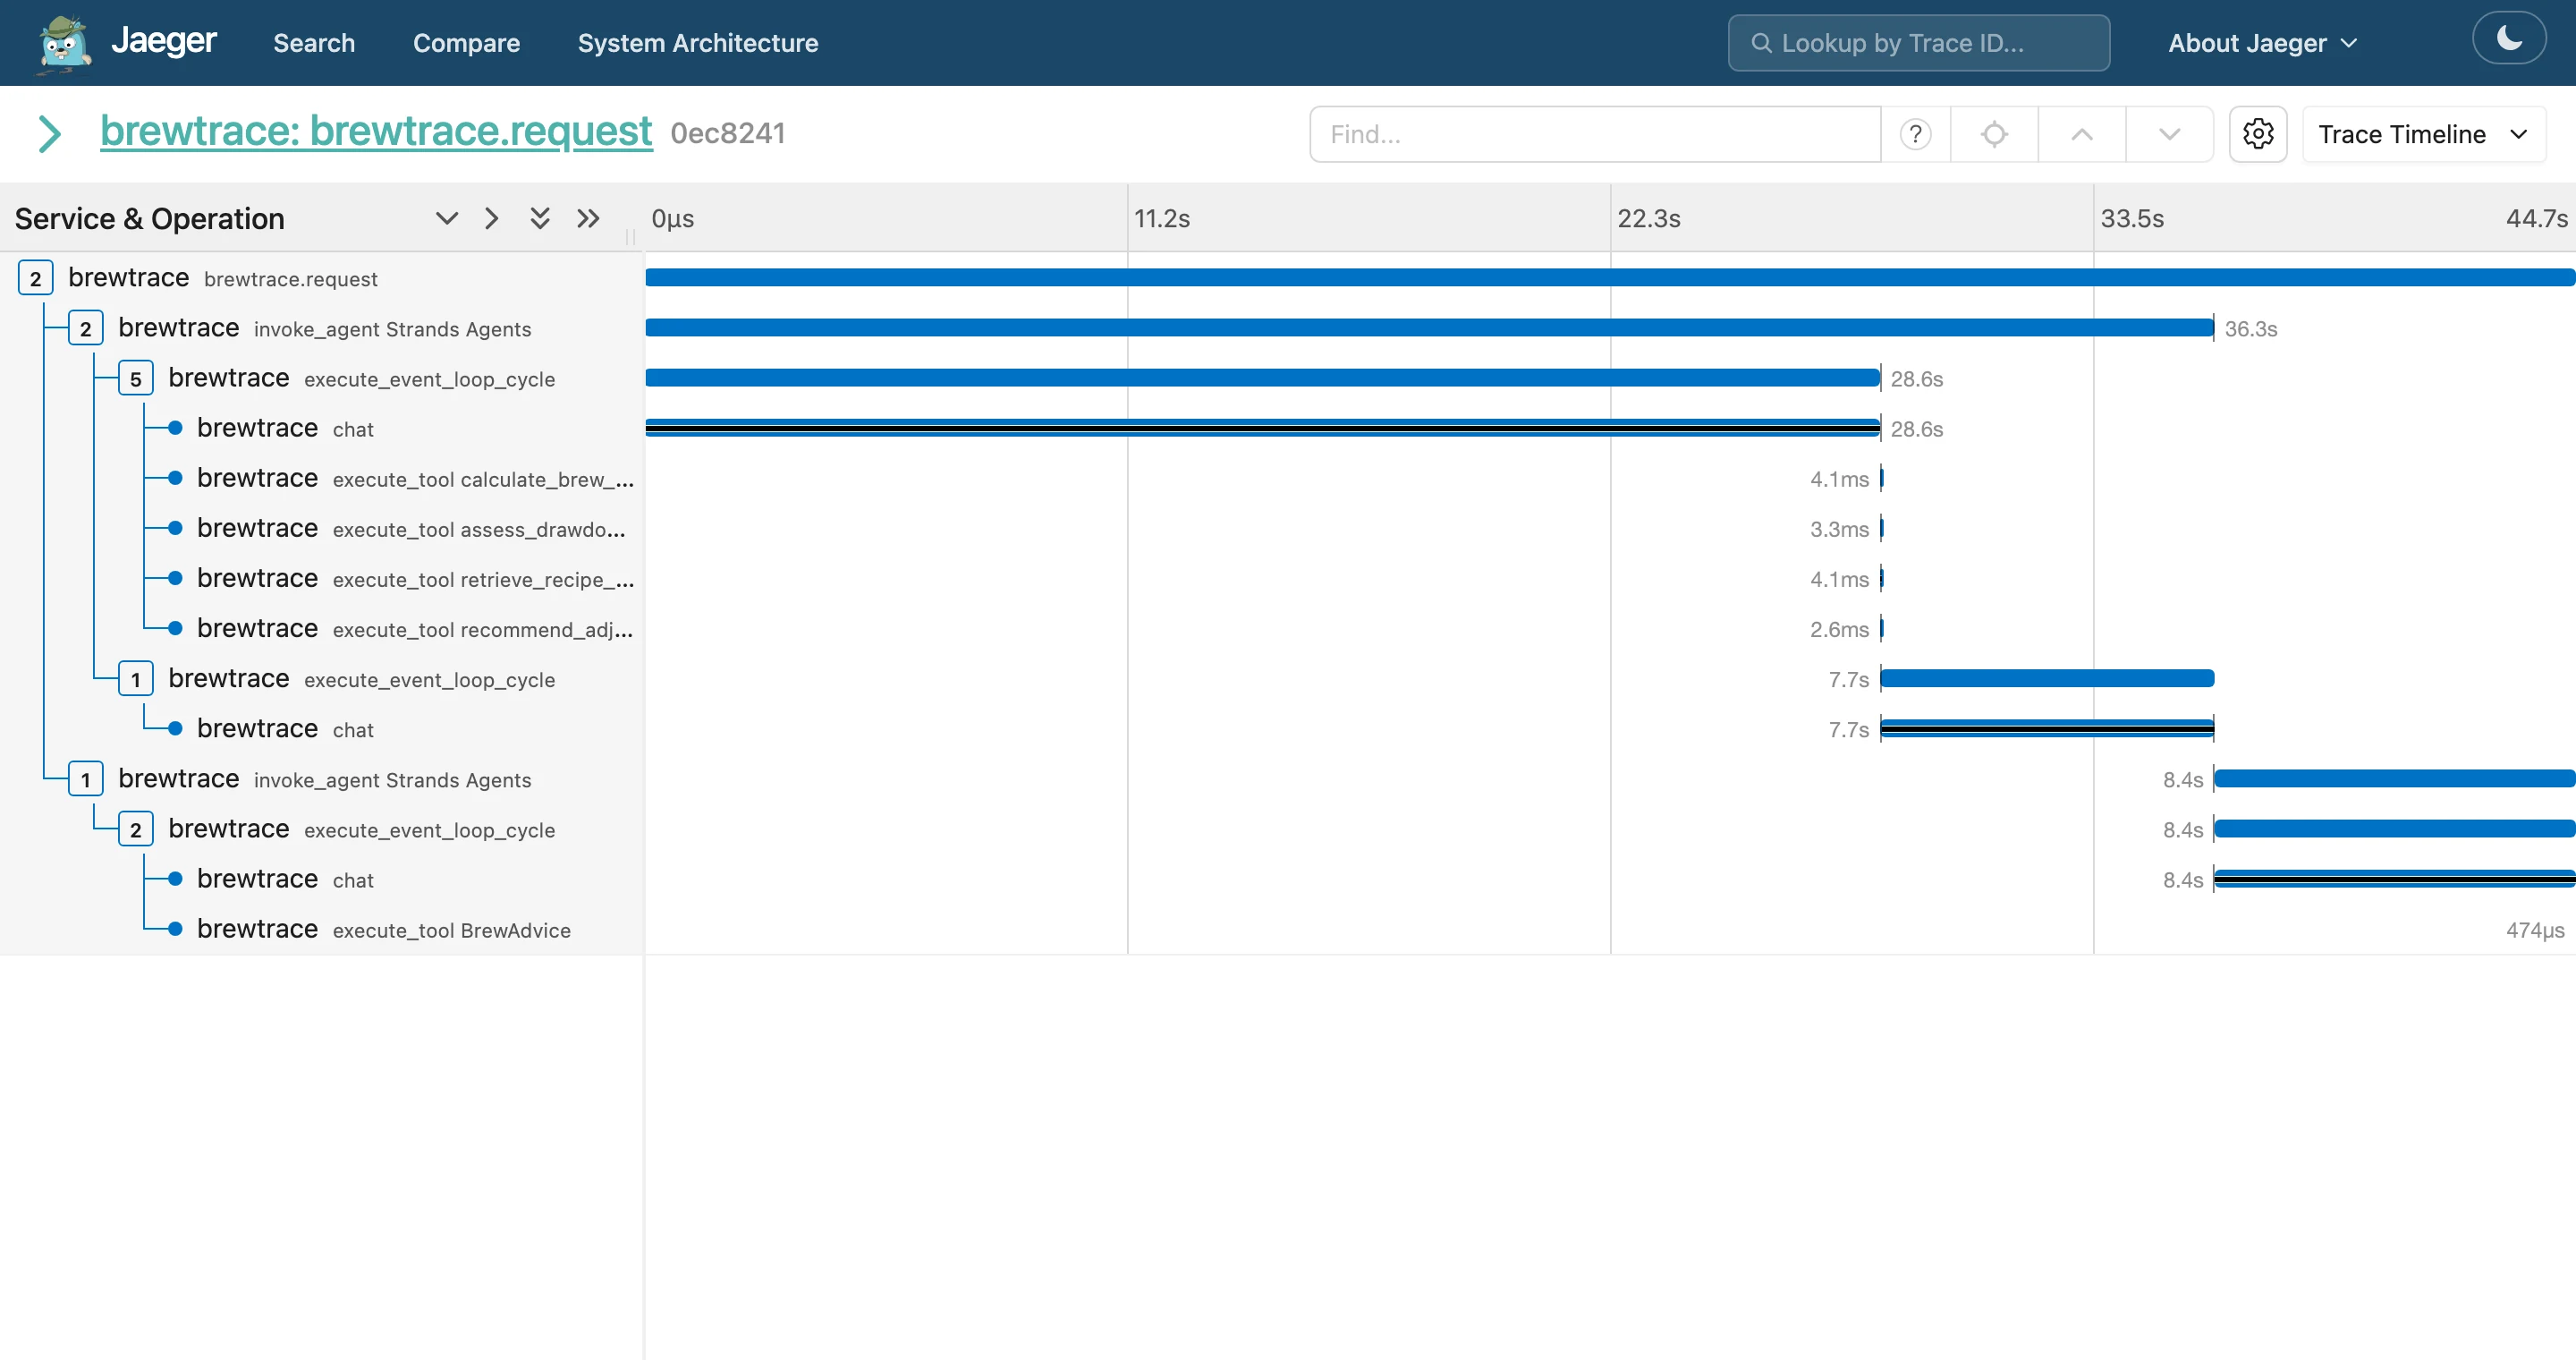
A live run of the demo brew in the Jaeger UI. The chat span carries 28.6 of the 44.7 seconds, the four tool calls take single-digit milliseconds, and the second, smaller invoke_agent at the bottom is the two-pass structured-output extraction.
Reading this trace answers every question from the intro. The retrieval span shows the exact
markdown sections the model saw. The chat span shows 35 of the 55 seconds went to one model
call (local 8B on CPU-adjacent hardware; keep_alive="10m" keeps the second run honest). The
tool spans prove the recommendation came from the rule engine instead of the model’s memory of
coffee forums.
The semconv sidebar you’ll hit eventually
The OpenTelemetry GenAI semantic conventions are still Development-status, and the attribute
names changed: gen_ai.system became gen_ai.provider.name, and
gen_ai.usage.prompt_tokens/completion_tokens became input_tokens/output_tokens.
What strands-agents 1.46.0 actually emits, observed in Jaeger:
- legacy
gen_ai.system=strands-agents(nogen_ai.provider.name) - token usage under both name generations, same values
- current-style span names (
invoke_agent,chat,execute_tool <name>)
If you build dashboards or alerts on these attributes, query both generations or pin your
framework version. OTEL_SEMCONV_STABILITY_OPT_IN=gen_ai_latest_experimental opts into newer
behavior where the SDK supports it. This churn is normal for a Development-status spec; design
for the rename instead of being surprised by it.
Evals as traces
The eval harness runs 25 troubleshooting cases with acceptable-adjustment sets:
- id: sour-thin-stalled-flips-to-temp
  input: "16g/250g V60, 92C, 5:00 drawdown, sour and thin"
  expected_defect: sour_thin
  acceptable:
    - { variable: temperature, direction: increase }
  notes: "drawdown 5:00 is slow/stalled; finer grind is contraindicated"
Against the deterministic pipeline these must pass 25/25, because the cases and the rule engine
are two views of the same table: a failure means one of them is wrong. Against the live agent
(run_evals --agent), each case runs inside its own brewtrace.request span tagged
eval.case_id and eval.passed. A failed eval becomes a Jaeger query (eval.passed=false)
that pulls up the complete trace of what the model did instead: which tool it skipped, what the
retrieval said, where it substituted its own judgment.
That loop, from eval failure to trace to root cause, is the entire reason to instrument an agent, and it works the same way whether the backend is this local Jaeger or a vendor’s.
The actual numbers, qwen3-8B, July 2026: 20/25 (80%). The five failures sort into three buckets, each visible in its trace:
- Direction semantics (2 cases): for “weak but balanced” the agent correctly said use more
coffee, but the structured extraction mapped that to
ratio/increase, and more coffee means a lower water:coffee ratio. The recommendation was right; the schema mapping lost it. - Priority drift (1 case): for a muddy cup it chose the rule table’s second-choice adjustment (coarser grind) over the first (more water). Defensible, but off-script.
- Substituted judgment (2 cases): with missing data, where the rule engine asks for more information, the model guessed anyway.
Each bucket suggests a different fix (better extraction prompt, stronger tool-result adherence, an explicit “say you don’t know” instruction), and you only know that because the traces separate them. A bare 80% score would tell you none of this.
The cases don’t have to stay synthetic. BrewTrace imports real brew history from a
BeanBench export (--from-beanbench export.json), so the agent can
rerun over brews you actually made and logged. BeanBench is the coffee logging iOS app I build;
it is also where the demo’s brewing rule table gets its ground truth about how real defects
present.
Metrics
Traces answer “what happened in this request”; metrics answer “what happens usually.” Enable the
meter and Strands emits metric instruments, with another spec-vs-reality gap worth knowing
before you build dashboards. The GenAI semconv defines gen_ai.client.token.usage and
gen_ai.client.operation.duration; what actually lands in Prometheus from strands 1.46 is
strands_event_loop_input_tokens, strands_event_loop_cycle_duration_seconds,
strands_tool_call_count, strands_model_time_to_first_token_milliseconds, and friends, under
framework-native names. BrewTrace adds a counter of recommendations by variable and an
end-to-end latency histogram. Jaeger stores traces only, so the compose file has a second
profile with Grafana’s single-container LGTM stack (Collector + Prometheus + Tempo + Loki +
Grafana):
docker compose --profile lgtm up -d
uv run brewtrace --metrics "16g/250g V60, 94C, 3:45, sour and thin"
Same OTLP ports, so the application config doesn’t change when you swap backends. That is the point of exporting OTLP instead of a vendor SDK.
Honest limitations
- An 8B local model is the floor of viable tool calling. The eval pass rate is the real number; publish it rather than cherry-picking demo runs.
- The first request after model load carries tens of seconds of cold-start inside the first
chatspan.keep_alivemitigates; know it’s there before profiling. - GenAI semconv will churn again. Version pins plus a dated “tested with” table are the difference between a tutorial and a trap.
Repo
Everything above, runnable:
github.com/jman4162/brewtrace-otel-agent.
Clone to first trace in about ten minutes: uv sync, ollama pull qwen3,
docker compose --profile jaeger up -d, one CLI call.
BrewTrace is an independent project I build on my own time. The views are my own and do not represent any current or former employer.
Frequently asked questions
Can you trace an LLM agent without an observability SaaS?
Yes. Strands Agents emits OpenTelemetry spans behind one setup call, and Jaeger v2 is built on the OpenTelemetry Collector, so a single Docker container ingests OTLP directly. The whole stack (agent, model, traces) runs on one machine with no API keys.
What spans does Strands Agents emit?
invoke_agent for the agent invocation, execute_event_loop_cycle per loop, chat per model call (with token counts and time to first token), and execute_tool <name> per tool execution. BrewTrace adds a manual parent span, brewtrace.request, stamped with domain attributes like brew.ratio and taste.primary_defect.
Which local Ollama models can call tools reliably?
Model choice dominates. In this project's 25-case eval, qwen3 8B walks the four-tool workflow essentially every time and scores 20/25 end to end; llama3.1 8B calls a tool when you name one explicitly but skips tools on open-ended prompts and answers from its own knowledge.
How do evals connect to traces?
Each eval case runs inside its own span tagged with eval.case_id and eval.passed. A failed eval becomes a Jaeger query (eval.passed=false) that pulls up the complete trace of what the model did instead, so each failure mode is diagnosable rather than a dent in an aggregate score.
More in AI agents
- MCP transport is a lifecycle decision · 2026-08-27
- A SysML v2 model that runs its own verification · 2026-08-21
- Data provenance for agentic AI workflows · 2026-08-17