How many runs does an agent benchmark need?
The search radar post ends with a line I have now written in some form three times: “Three attempts per arm is enough to see a direction, and nothing here is a pass rate with error bars.” The free lunch post says the same thing about the same harness. I meant it every time, and never worked out what the number would have to be.
Here is the answer I should have had first. At three attempts per arm, the best outcome the experiment can produce, a clean sweep against a shutout, gives a two-sided p of 0.10 under Fisher’s exact test. The comparison cannot come out significant. That is fixed by the size of the experiment, and it is knowable before any agent runs.
I wrote about building an eval harness in July. That post said confidence intervals beat point estimates and moved on. This is the part it skipped, worked through on my own published numbers.
The floor at three attempts
Fisher’s exact test conditions on the row and column totals of a two-by-two table. With three attempts in each arm and three passes across the six, there are twenty ways to deal the passes, so the most extreme arrangement carries probability 1/20 in each tail. Two-sided, that is 0.10, and no arrangement is more extreme than the one you already got.
| attempts per arm | best possible outcome | Fisher two-sided p |
|---|---|---|
| 2 | 2/2 against 0/2 | 0.333 |
| 3 | 3/3 against 0/3 | 0.100 |
| 4 | 4/4 against 0/4 | 0.029 |
| 5 | 5/5 against 0/5 | 0.008 |
| 6 | 6/6 against 0/6 | 0.002 |
Four per arm is the first count that can clear 0.05, and only on a perfect separation.
The test matters here, so it is worth naming rather than assuming. Fisher’s conditioning on both margins makes it conservative. Barnard’s exact test drops that conditioning and maximizes the tail probability over the unknown common pass rate instead; on the same three-versus-three table it returns a one-sided p of 1/64. That maximum is attained at a rate of one half, where the observed split is the only outcome in the tail and each of the six attempts contributes a factor of one half. Fisher’s own one-sided p on that table is exactly 0.05, which does not clear a strict threshold either.
So the honest form of the claim is narrower than the headline. Under the conditional test that most people reach for, three per arm has a ceiling above 0.05. Under an unconditional test it does not. Either way the reported number should say which test produced it.
What my own comparisons support
Both AEDL composition measurements ran Claude Code on Sonnet 5 with a thirty minute timeout, three attempts with the physics libraries importable and no tools attached, three with the opensatcom and APAB MCP servers attached. The bundles are committed.
| comparison | outcome | Fisher two-sided p |
|---|---|---|
| t3-001, MCP against library | 2/3 against 0/3 | 0.40 |
| t3-002, MCP against library | 3/3 against 1/3 | 0.40 |
| both tasks pooled | 5/6 against 1/6 | 0.080 |
Neither task on its own gets within a factor of eight of a conventional threshold. Pooling the two tasks is itself a modelling decision worth stating out loud, since the tasks have different difficulties and a stratified exact test is the defensible version rather than stacking the counts. Even stacked, it does not clear 0.05.
That is a fair description of what those runs support. They were enough for the decision they were run to make, which was whether to build a coordination package on top of the MCP servers, and the answer was no. They are not evidence anyone should cite about MCP in general, and the run notes in the repository have said so since the day they were written.
A clean sweep is a wide interval
The other habit worth breaking is reporting a small pass rate as a number.
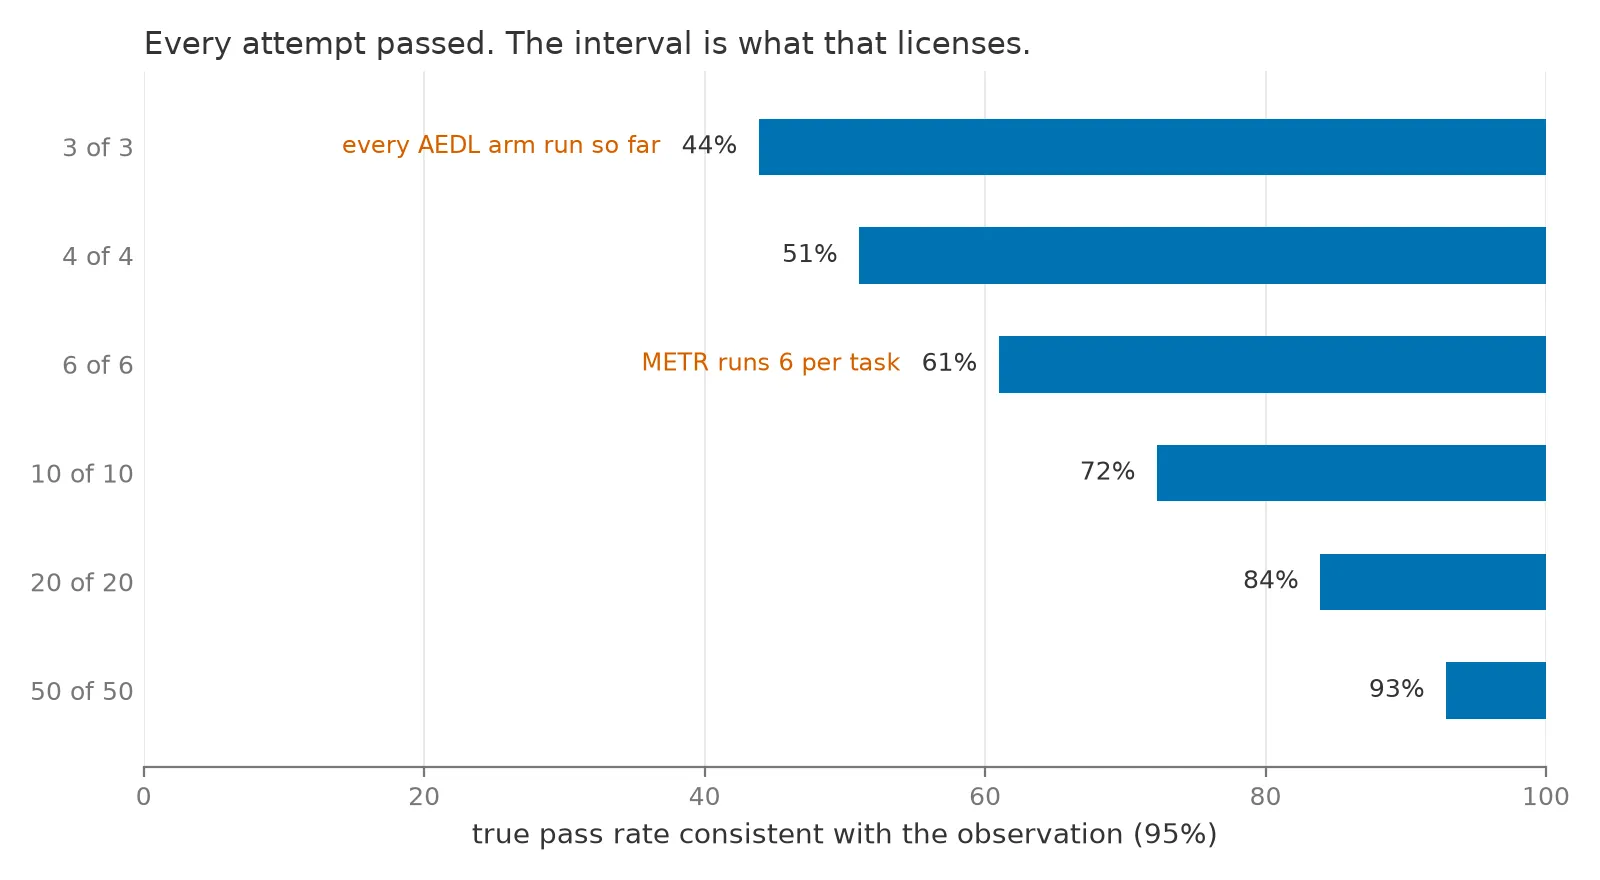
Wilson 95 percent intervals for an observation in which every attempt passed. The script computes each bound and checks it against the score equation it solves before drawing anything.
The t2-001 calibration run reported three of three. What that licenses is a true pass rate
somewhere between 44 percent and 100 percent. Ten of ten would move the floor to 72 percent,
and fifty of fifty to 93 percent.
Wilson rather than the textbook normal interval, because at a perfect score the normal interval has zero width, which is visibly wrong. Wilson keeps a sensible interval at the boundary, which is exactly where small agent benchmarks tend to land.
What it would take to see a difference
Power is the probability that a comparison comes out significant given that the two configurations really do differ. Enumerated exactly for Fisher’s test, over the full joint outcome space rather than by simulation:
| true pass rates | n = 3 | n = 10 | n = 20 | n = 40 |
|---|---|---|---|---|
| 80% against 30% | 0.000 | 0.426 | 0.846 | 0.996 |
| 80% against 50% | 0.000 | 0.132 | 0.409 | 0.749 |
| 90% against 80% | 0.000 | 0.012 | 0.072 | 0.162 |
The first row is a difference so large you would see it by reading the workspaces, and it still needs twenty attempts per arm to be caught reliably. The third row is the one that should change behavior: a ten point improvement between two working configurations is out of reach at forty attempts per arm, and forty per arm is already far more than anyone runs on a side project. Those are the differences people argue about when a new model ships.
What the attempts cost
The fifteen scored attempts across those three task batches cost $46.43 in API-equivalent terms, a mean of $3.10, rising to $3.55 across the Tier-3 architecture tasks. They were covered by a subscription, so the dollar figures are what the adapter estimated rather than what was billed.
At $3.55 an attempt, one two-arm comparison on one task costs about $21 at three attempts per arm, $71 at ten, $142 at twenty, and $284 at forty. Multiply by a second task, a second model family, and the re-run you owe yourself after every harness fix. The wall clock is the harder limit: the timeout is thirty minutes, and the library arm hit it twice.
This is the real reason small benchmarks run three attempts. The count is set by a budget. The EvalEval Coalition’s note on eval costs puts numbers on the same pressure at a larger scale. One agent configuration cost $2,828 to evaluate on GAIA and scored 28.5 percent, while another reached 57.6 percent for $1,686. On Online Mind2Web it reports a nine-fold cost difference buying two percentage points of accuracy. Deciding how many runs to buy is a real engineering tradeoff, and the useful move is to price it rather than to leave the count unexamined.
What to do with three runs
Three attempts per arm is what most people can afford, so the question is what three attempts are good for.
Report the interval instead of the ratio. Writing “3/3” invites a reader to hear 100 percent. Writing “3/3, 95 percent interval 44 to 100 percent” costs one clause and says the true thing.
Spend small batches on the benchmark rather than on the agents. Every real defect in my own
harness surfaced in a batch of three attempts or fewer. The first t2-001 task collapsed
because a constant 45 degree offset made every quantized phase exactly representable, and an
agent found it on the first attempt. The sidelobe metric was scoring the main lobe’s skirt and
saturating once designs improved past it, so further improvement stopped registering. All three
calibration manifests recorded zero instrumented physics calls, which turned out to be two
separate problems: the shim never reached the interpreter the agent actually used, and later,
in the MCP arm, the server processes did not inherit it either. Three runs is plenty to show
that a benchmark cannot see what it claims to measure, and useless for ranking two agents that
both work.
Choose effects large enough to be visible at the budget you have. A comparison designed around a five point difference at three attempts per arm is not an experiment.
Pair the arms. Identical task, identical fixtures, identical budgets, identical harness version, and ideally the same day. The composition runs did this and it is why the direction is worth anything at all.
Put the caveat in the artifact. The run notes in the repository carry the attempt counts and their limits, so the number and its qualification travel together. A caveat that lives only in a blog post detaches from the number within one citation.
What the bigger studies found
Working this out on fifteen runs is a small version of a question the field has now measured at scale. On Randomness in Agentic Evals (Bjarnason, Silva and Monperrus, February 2026) collected 60,000 agentic trajectories on SWE-Bench-Verified across three models and two scaffolds. Single-run pass@1 estimates varied by 2.2 to 6.0 percentage points depending on which run was selected, with standard deviations above 1.5 percentage points even at temperature zero. Their conclusion is blunt: “reported improvements of 2-3 percentage points may reflect evaluation noise rather than genuine algorithmic progress.” Their sample-size guidance is that detecting a 2 percent improvement at p below 0.05 with 80 percent power takes roughly nine runs per agent, and a 1 percent improvement takes thirty-six.
Those run counts are not transferable to the tables above, and the difference is worth being careful about. Their run is one pass over a benchmark of hundreds of tasks, so its variance is the variance of an average. My attempt is one shot at a single task, where the outcome is a single bit. The same word covers two different quantities.
METR offers the most useful operational anchor I found: it launches six independent runs for each task, and states that measurements above sixteen hours are unreliable with its current task suite. Six is a real number chosen by people who do this full time, and it sits close to the point where a perfect score starts meaning something.
Two more results explain why the arms in a comparison can differ at all. Harness-Bench (May 2026) ran a full factorial of six harnesses against eight backends over 106 tasks and found scores spanning 52.4 to 76.2 percent, a 23.8 point gap under the same task set and model pool. Epoch AI’s survey of benchmarking difficulty found that switching the scaffold alone makes up to an 11 point difference for GPT-5 and up to 15 for Kimi K2 Thinking on SWE-bench Verified. Capability belongs to a model and harness together, which is the premise the composition measurement was built on.
The statistical framing all of this rests on is Evan Miller’s Adding Error Bars to Evals, whose opening move is the one worth borrowing: “Fundamentally, evaluations are experiments; but the literature on evaluations has largely ignored the literature from other sciences on experiment analysis and planning.”
If you would rather not hand-roll any of this,
Inspect AI already implements it. Repeated attempts are the
--epochs option, pass_at and pass_k are built-in reducers over those epochs, and the
scorer module ships stderr() with optional clustered standard errors alongside a bootstrap
alternative. The arithmetic in this post is not novel and does not need to be reimplemented.
What this does not show
The costs are API-equivalent estimates against a subscription rather than invoiced amounts. One model family, one agent CLI, three tasks, fifteen scored attempts, and only two of those tasks carry a two-arm comparison, so nothing here is a claim about agents in general.
Two limits matter more than the sample size. First, the power table assumes attempts are independent draws at a fixed per-attempt rate. Real attempts share a task, a prompt, a model snapshot and often an afternoon, and correlated attempts buy less information than independent ones, so the counts above are optimistic. Second, collapsing each attempt to a pass or a fail throws away most of what the evaluator produced. The t3-001 attempt that failed on link margin missed it by 1.13 dB, and the t3-002 attempt that failed on frame time came in at 1.07 occupancy against a ceiling of 1.0. Comparing those margins directly, instead of the bits they were reduced to, would need far fewer attempts for the same confidence. That is the obvious next thing to build, and it is not built yet.
Try it
Everything above is reproducible. The figure script prints every interval, p-value and power
number before it draws, checks each Wilson bound against the score equation it solves, and
checks each Fisher p-value against scipy.stats.fisher_exact:
git clone https://github.com/jman4162/aedl-electromagnetic-design-agent
cd aedl-electromagnetic-design-agent
pip install -e ".[dev]"

# the committed run bundles behind every number quoted here
cat runs/README.md

# more attempts than I ran, which is the entire point
aedl run --task t3-002 --agent claude --model sonnet --attempts 8
aedl report --runs-dir runs --out leaderboard.md
Every number above is computed by scripts/wilson_power_figure.py in this site’s repository
and cross-checked against an independent implementation before use. The outcomes, costs and
wall times come from the committed run bundles in AEDL, re-read from disk while writing.
AEDL and the phased-array tools are independent projects I build on my own time. The views are my own and do not represent any current or former employer.
Frequently asked questions
Why can't three attempts per arm produce a significant result?
With three attempts in each of two arms there are only twenty ways to arrange three passes across the six attempts, so the single most extreme split carries probability 1/20 in each tail. A clean sweep against a shutout, three of three versus zero of three, gives a two-sided Fisher p of 0.10. Every other outcome is less extreme. The ceiling is a property of the experiment's size, and it holds before any agent runs. Four attempts per arm is the first count that can clear 0.05, at p = 0.029.
Is that a universal statement about three-run comparisons?
No, it is a statement about Fisher's exact test, which conditions on both margins and is known to be conservative. Barnard's exact test maximizes over the nuisance rate instead, and on the same three-versus-three table it returns a one-sided p of 1/64, or 0.0156. Fisher's one-sided p on that table is exactly 0.05, which does not clear a strict threshold either. If you report a small comparison, name the test, because the answer changes with it.
What does a pass rate of three out of three actually tell you?
That the true pass rate is somewhere between 44 percent and 100 percent, as a 95 percent Wilson interval. Ten of ten narrows it to 72 percent and above; fifty of fifty to 93 percent and above. A perfect small sample is compatible with a system that fails almost half the time.
How many attempts would it take to compare two agent configurations?
It depends entirely on the size of the difference. Exact power for Fisher's test at twenty attempts per arm is 0.85 for a true 80 percent against 30 percent, 0.41 for 80 against 50, and 0.07 for 90 against 80. The differences argued about between model releases sit in that last row and are out of reach at any attempt count an individual pays for.
So what are three runs good for?
Finding defects in the benchmark. Every real problem in my own harness turned up in a batch of three or fewer: a task that collapsed to a free change of phase reference, a sidelobe metric that saturated once designs improved past it, a call counter that logged zero because it named an entry point that did not exist. Three runs is plenty to show that a benchmark is broken and useless for ranking two working agents.
More in AI agents
- MCP transport is a lifecycle decision · 2026-08-27
- A SysML v2 model that runs its own verification · 2026-08-21
- Data provenance for agentic AI workflows · 2026-08-17