What a beamformer that drives the FEM directly changes in an X-band radar
Qorvo has announced the QPX0252, a four-channel beamformer IC for X-band AESA radar covering 7.9 to 12 GHz. Its transmit output drives Qorvo’s front-end modules directly, so the discrete driver amplifier that normally sits between beamformer and FEM leaves the lattice. Qorvo also claims up to 20 dB higher cascaded input P1dB in a high-linearity receive mode, and companion bias and switch-control parts give sub-100 ns transmit/receive switching. Samples and evaluation kits are available now.
The catch in the announcement is that direct drive works with Qorvo FEMs, and the 20 dB figure is the vendor’s, stated against unnamed “conventional” architectures. Qorvo’s data sheet brief (Rev A, September 2026, marked pre-production) adds that the part is CMOS in an FC-CSP package, with 6-bit phase control (5.625° LSB), 6-bit gain control (0.5 dB LSB), dual-beam receive and SPI-selectable receive and transmit modes. It gives no gain, noise figure, P1dB or output power. So I ran the architecture through my own modeling stack to answer two questions: what would the beamformer have to deliver for the claims to hold, and when would a radar designer care?
What I modeled without RF numbers
Every beamformer RF number below is an assumption. I bracketed them against two parts with published numbers: the QPF5012 FEM that Qorvo pairs with the QPX0252, and the ADAR1000, a four-channel 8 to 16 GHz beamformer that stands in for “conventional”.
| Parameter | Value | Source |
|---|---|---|
| FEM band | 8.5 to 10.5 GHz | QPF5012 product summary |
| FEM transmit | 40.5 dBm Psat, 20.5 dB large-signal gain, 40% PAE | QPF5012 |
| FEM receive | 23 dB gain, 2.2 dB NF, 13.8 dBm Psat, 20.7 dBm OIP3 | QPF5012 |
| FEM receive input P1dB | -11.2 dBm | derived: Psat minus 3 dB, referred to input |
| Conventional beamformer receive | 10 dB gain, -16 dBm IP1dB, -7 dBm IIP3 | ADAR1000 at 9.5 GHz |
| Conventional beamformer transmit | 10 dBm OP1dB, 14 dBm Psat | ADAR1000 |
| QPX0252 phase and gain control | 6 bits each; 5.625° and 0.5 dB LSB | QPX0252 data sheet brief |
| Beamformer receive NF | 8, 14 or 20 dB | assumption bracket |
| Driver amplifier | 12 dB gain, 25 dBm OP1dB, 1 W DC | assumption |
The array is a 9.5 GHz search radar: 32 by 32 elements, one FEM per element, one four-channel IC per 2 by 2 tile, so 256 ICs. The target is 1 m², Swerling 1, 16 pulses integrated noncoherently at Pd 0.9 and Pfa 10⁻⁶.
The cascade, aperture and mission numbers come from phased-array-systems 0.14.1 and phased-array-modeling 1.5.0, called through APAB’s engine wrappers. The requirement check runs in sysml2kit. One script regenerates every figure.
The FEM sets the band
The QPX0252 covers 7.9 to 12 GHz, but the QPF5012 covers 8.5 to 10.5 GHz. In this pairing the array is a 21% bandwidth array, and the beamformer’s extra range only matters if another direct-drive FEM exists for the rest of the band.
The band edge also fixes the lattice. For grating-lobe-free scan to 60° at 10.5 GHz, element spacing has to stay under , which is 15.3 mm. That is 0.485λ at band center and makes the aperture 0.49 m on a side. The FEM’s 7 by 5 mm package fits inside a 15.3 mm cell with room for the feed. The brief lists an FC-CSP package without dimensions.
The 20 dB claim needs a +4.8 dBm beamformer
In the conventional receive chain the FEM’s LNA gives 23 dB of gain ahead of the beamformer. Referred to the FEM input, the beamformer’s -16 dBm IP1dB becomes -39 dBm, which is 28 dB below the LNA’s own compression point. So the beamformer sets the cascaded P1dB. The reciprocal-sum cascade gives -39.0 dBm, with the beamformer as the binding stage, and a hand Friis calculation agrees to the second decimal.
That arithmetic makes the vendor claim easy to test. Hold the FEM fixed and sweep the beamformer’s input P1dB. A 20 dB improvement at the chain input needs a beamformer IP1dB of +4.8 dBm, about 21 dB above the ADAR1000. The ceiling is the LNA by itself at -11.2 dBm, so the most any beamformer could buy behind this FEM is 27.8 dB. “Up to 20 dB” sits inside that bound, which makes it plausible. It is still unverified.
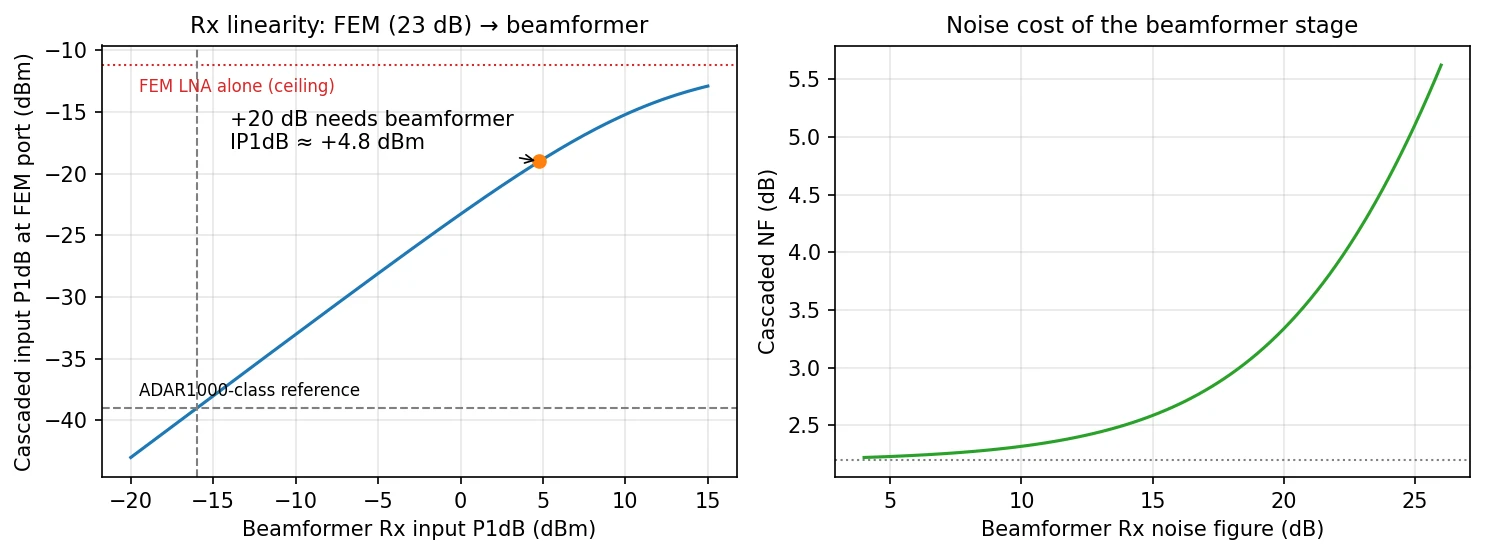
The cost shows up in noise figure. High-linearity modes usually trade NF for headroom, and that NF arrives behind 23 dB of gain. A beamformer NF of 8 dB adds 0.07 dB to the cascade (2.27 dB total), 14 dB gives 2.51 dB, and 20 dB gives 3.34 dB. Up to about 14 dB the 23 dB of LNA gain hides the beamformer. Past that, it starts to cost range.
Direct drive means about +20 dBm per channel
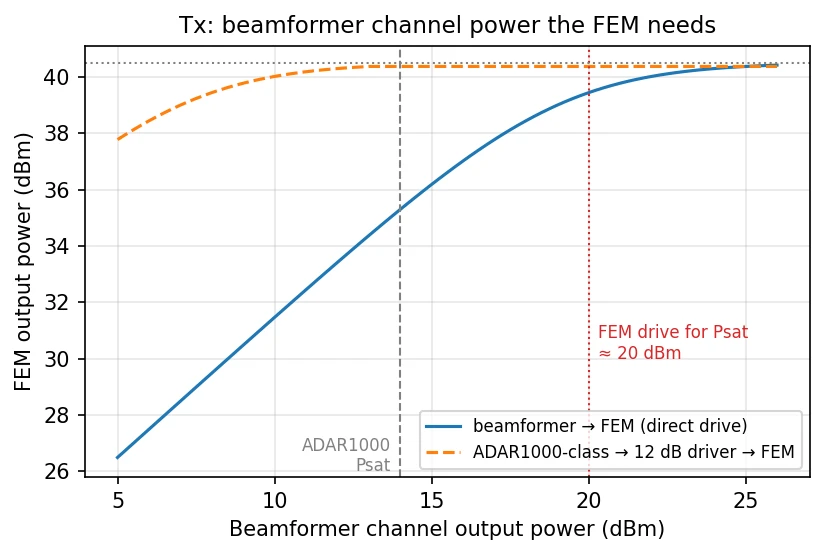
The FEM reaches its 40.5 dBm saturated output with about 20 dBm of drive. The ADAR1000 saturates at 14 dBm, 6 dB short. Driven directly, a soft-limiter model of the FEM puts out 35.3 dBm, about 3.4 W of the 11 W it can deliver. That shortfall is why conventional X-band tiles add a driver. For direct drive to work, each QPX0252 channel has to deliver close to +20 dBm, about 100 mW, four times over per IC. The brief lists a separate 3.0 V supply for the transmit PA. Getting +20 dBm per channel at X-band from CMOS on 3 V is the number I would measure first on an evaluation kit.
What does dropping the driver buy? Counting beamformer ICs, drivers and FEMs, the 1,024-element array goes from 2,304 RF parts to 1,280, a 44% cut. That also removes 1,024 places for gain and phase to drift between units. DC power barely moves. At 40% PAE each FEM draws about 28 W at peak, so a 1 W driver is 3.4% of transmit DC. At 10% duty the FEMs dissipate 0.72 W/cm² averaged over the aperture, inside the forced-air class, and the drivers would have added 0.04 W/cm² of that. The benefit is assembly, calibration and board area, more than power or heat.
Phase steering across the FEM band costs 13 dB at 60°
An analog beamformer steers with phase shifters, and a phase shift is only the right delay at one frequency. With weights set at 9.5 GHz and a 60° command, the beam lands at 75.5° at 8.5 GHz and 51.6° at 10.5 GHz. The half-power half-width at 60° is 3.3°, so at the band edges the gain toward the commanded direction is down 13.2 dB.
This only matters if the waveform’s instantaneous bandwidth spans the band. A frequency-agile radar that hops channel to channel reloads phase states per hop, and the SPI-loaded beam states make that routine. For wideband instantaneous use (EW, wideband SAR), the fix is true time delay above the IC. In this model one delay line per 8 by 8 subarray (16 ICs each, 16 delay lines in total) cuts the band-edge loss at 60° to 1.8 dB.
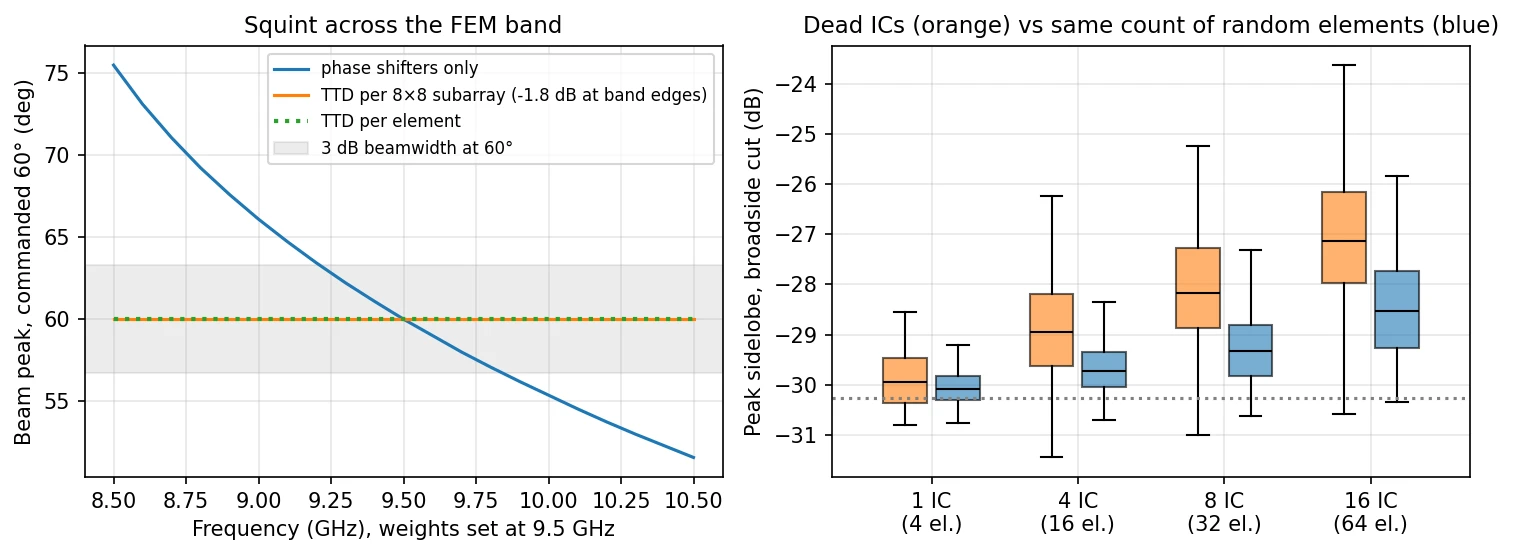
Phase resolution is one number the brief does give: 6 bits, a 5.625° step. For the -30 dB Taylor taper, the worst peak sidelobe over 5° to 55° of scan is -24.0 dB with 5-bit phase, -26.6 dB with 6 bits and -28.2 dB with 7 bits (ideal -30.3 dB). The ADAR1000’s 2.8° step is about 7 bits. Adding the QPX0252’s 0.5 dB gain steps to the 6-bit phase leaves the worst sidelobe at -26.6 dB, and the taper’s 24.4 dB edge attenuation fits inside the 31.5 dB gain range. Phase quantization sets the floor, costing up to 3.7 dB of a -30 dB taper’s sidelobe margin at the worst scan angles. These are deterministic quantization lobes. Random phase offsets added during calibration break them up, and I did not model that.
A dead IC is a 2x2 hole, and it shows in the sidelobes
Four channels per IC changes the failure model. When an IC fails, four neighboring elements go dark together, and a correlated hole raises sidelobes more than the same number of scattered failures does. Over 200 random trials, 16 dead ICs (64 elements, 6% of the array) move the median peak sidelobe from -30.3 to -27.1 dB. Sixty-four random element failures move it to -28.5 dB. At the 90th percentile the gap is 2.1 dB (-25.0 versus -27.1 dB). For an availability analysis this means counting failures in ICs. Counting elements as independent understates the sidelobe hit.
A 20 dB P1dB gain matters only near strong emitters
The mission model separates two regimes.
Thermal-noise-limited search barely notices linearity and pays for any NF the high-linearity mode costs. With the cascaded NF from the receive cascade, the array’s detection range on a 1 m² target falls from 24.8 km (beamformer NF 8 dB) to 23.4 km (beamformer NF 20 dB), a 6% loss. In sea state 3 at 10 km, signal-to-clutter-plus-noise is -3.2 dB in both cases, because clutter dominates and receiver noise is irrelevant. This model has no Doppler processing, which is what a real radar would rely on there.
Large signals are where the claim pays off. X-band marine navigation radars transmit at 9.41 GHz, inside this array’s band and its preselection. A 25 kW magnetron into a 30 dBi slotted waveguide puts out about 104 dBm EIRP in its main beam and about 79 dBm in a -25 dB sidelobe. Into a 5 dBi element, the conventional chain (-39 dBm IP1dB) compresses within 64 km of that main beam and within 3.6 km of its sidelobes. The +20 dB chain cuts those distances tenfold, to 6.4 km and 360 m. For a coastal or shipboard radar operating among other ships, that is the difference between compressing on most of the traffic and compressing only on close neighbors.
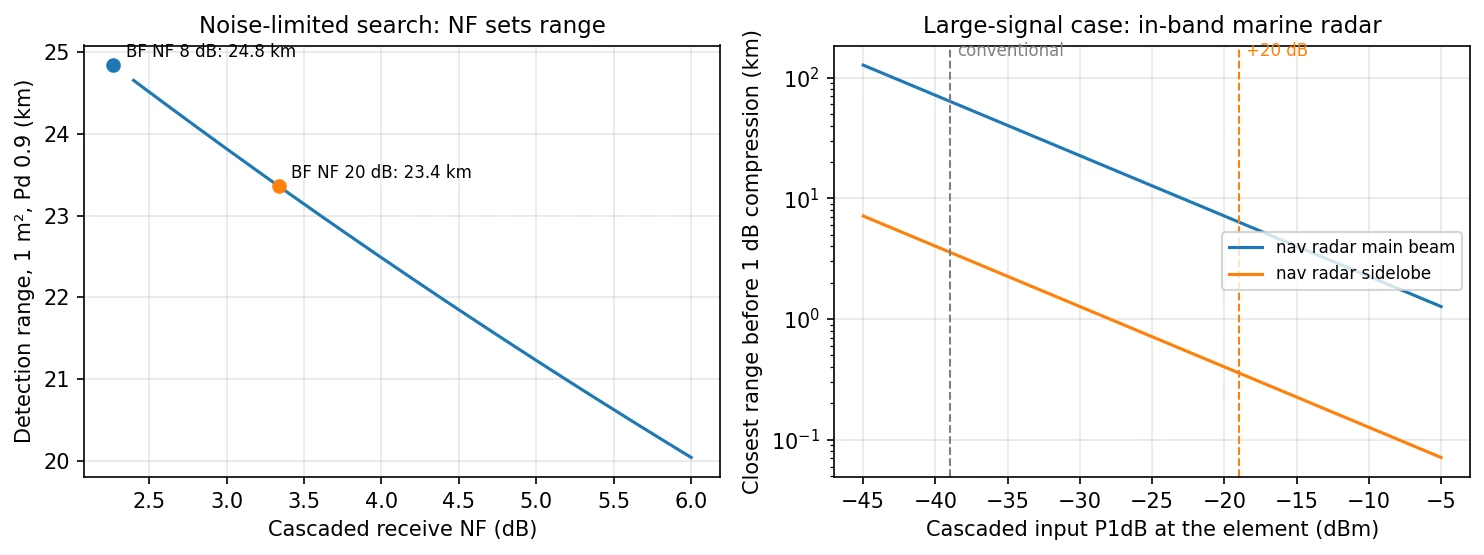
Compression here happens at the element, before the analog combiner. The array’s spatial filtering cannot help with an interferer that saturates the channel ahead of the summing node. That is the reason input P1dB is quoted at the element.
The requirement check says neither mode closes alone
I wrote the trade as a small SysML v2 model on top of
sysml2kit-rf-library’s
part definitions, with two requirements and two analyses. Each analysis binds
to a phased-array-systems study, one per receive mode, and both modes are
checked against the same requirements. The thresholds are mine and
illustrative. The range floor is 24 km. The linearity floor is a cascaded
IIP3 of -13 dBm, which corresponds to surviving the navigation radar’s
sidelobe at 500 m. sysml2kit verify returns:
| Requirement | Low-noise mode | High-linearity mode |
|---|---|---|
| REQ-RANGE: detection range ≥ 24 km | 24.84 km, pass (+840 m) | 23.36 km, fail (-640 m) |
| REQ-IIP3: cascaded IIP3 ≥ -13 dBm | -30.0 dBm, fail (-17.0 dB) | -10.0 dBm, pass (+3.0 dB) |
The requirement is on IIP3 because phased-array-systems’ evaluation path exported cascaded IIP3 but not cascaded P1dB. A pull request adds P1dB to its output. The table’s point is structural. With modes selectable over SPI, linearity versus sensitivity stops being a hardware choice and becomes a per-dwell scheduling decision driven by the local interference picture. The beamformer makes that possible, and the radar’s resource manager has to use it.
Can a 9B local model reproduce these numbers?
Four of the case-study questions went into my tool-surface eval bench as a separate task file, run through APAB’s agent loop with two local Ollama models, three repeats each. The first run used APAB 0.5.1’s tools:
| Task | qwen3.5:9b | llama3.1 8B |
|---|---|---|
| Detection range at broadside | 3/3 | 0/3 |
| Detection range at 45° scan | 2/3 | 0/3 |
| Sea-clutter SCNR at 10 km | 1/3 (2 silently wrong) | 0/3 |
| Range at a 3.34 dB noise figure | 0/3 (3 silently wrong) | 1/3 |
The silent failures matter more than the totals. On the sea-clutter task qwen
called the tool without the clutter arguments the tool accepts, and reported
clear-air SNR (27.2 dB) as the SCNR (-3.2 dB). The noise-figure task could not
be done at all: 0.5.1’s system tool had no noise-figure input, so the right
answer was to say so. Qwen noticed the result reported
noise_figure_used_db: 3.0, wrote that this might be “a discrepancy”, and
returned the 3 dB range anyway, three times out of three. Llama’s one correct
answer there came from the wrong reason: it gave up after failing to fill in
the array arguments.
That task exposed a gap in APAB. The system tool couldn’t express the one
receiver parameter this case study turns on, so an agent working through it
couldn’t run the trade. APAB 0.5.2 adds noise_figure_db to system_evaluate.
On the new tools qwen answered the noise-figure task correctly three times out
of three, and 11 of 12 runs overall. Its other gains (scan 3/3, clutter 2/3)
are within run-to-run noise at three repeats, so I credit the fix with the
noise-figure task only. Llama went 0/12 on both versions. Four tasks and three
repeats make an anecdote. The 24-task tool-surface study this harness was built
for is still being written up.
What this does not show
- No QPX0252 measurements or RF data sheet numbers. The +4.8 dBm, +20 dBm and NF values are derived from the claims; the part’s actual values are unknown. The phase and gain resolution come from a pre-production brief and may change.
- The FEM’s receive P1dB is derived from its published saturation power, and the cascade P1dB uses the first-order reciprocal sum, which slightly overstates the P1dB of a chain whose last stage is driven hard.
- The beamformer’s dual-beam receive mode, its gain and phase control ranges, and calibration were not modeled.
- The mission model is closed-form: no Doppler or MTI processing, no element-pattern scan loss beyond a cosine model, no measured clutter.
- There is no full-wave element result. My EdgeFEM unit-cell check failed to build periodic boundaries on the current release, and I stopped rather than publish a workaround.
- Part count is not cost. No QPX0252 or QPF5012 pricing was public, and the lock-in cost of single-sourcing both the IC and the FEM does not show up in any of these models.
Try it
git clone https://github.com/jman4162/agentic-phased-array-builder apab
cd apab
python -m venv .venv && source .venv/bin/activate
pip install -e ".[dev]" "phased-array-systems==0.14.1" "sysml2kit[parse,verify]" sysml2kit-rf-library

# every number and figure in this post
python examples/09_xband_beamformer_case_study.py

# the requirement check
cd examples/xband_qpx0252_sysml
M=$(python -c 'import sysml2kit_rf_library as m; print(m.models_dir())')
sysml2kit verify XbandAESA.sysml $M/RFVocabulary.sysml $M/RFParts.sysml \
  $M/RFRequirements.sysml $M/RFAnalyses.sysml
The numbers above are read from the script’s results.json and the
verification report. The vendor claims are as published by Qorvo and were not
independently tested. These are independent projects I build on my own time.
The views are my own and do not represent any current or former employer.
Frequently asked questions
Did you test the QPX0252?
No. Qorvo's pre-production data sheet brief gives the phase and gain control resolution but no gain, noise figure, P1dB or output power, so every beamformer RF value is an assumption bracketed against the ADAR1000, a published four-channel X/Ku beamformer, and the QPF5012 front-end module's published numbers. The post works out what the beamformer would need to deliver for Qorvo's claims to hold, and what those claims change at array and mission level.
Is a 20 dB higher cascaded input P1dB physically plausible?
Yes, if the beamformer's own receive input P1dB is about +4.8 dBm in its high-linearity mode, roughly 21 dB above the ADAR1000's -16 dBm. With 23 dB of LNA gain in front of it, the beamformer sets the conventional chain's compression point, so beamformer linearity converts almost one for one into chain linearity until the FEM's own LNA becomes the limit about 28 dB higher.
Does removing the driver amplifier save much power?
Not much. A 10 W GaN FEM at 40 percent efficiency draws about 28 W of DC at peak, so a 1 W driver is about 3 percent of transmit DC. The larger effect is part count: 1,024 fewer RF parts in a 1,024-element array, out of 2,304.
Which receive mode should the radar use?
Neither mode closed both of my illustrative requirements. The low-noise mode met a 24 km detection range and failed the interferer requirement by 17 dB; the high-linearity mode met the interferer requirement and fell 640 m short on range. Because the modes are selectable over SPI, the practical answer is to pick the mode per dwell from the interference picture.