Failure taxonomies for ML and decision systems
Suppose two agent systems each pass 80 of 100 tasks. Same benchmark, same budget, same headline number. Here is what the 20 failures look like in each, with counts chosen to make the point rather than measured from a real run:
| Failure | System A | System B |
|---|---|---|
| Retrieval miss | 12 | 2 |
| Invalid tool arguments | 5 | 3 |
| Grader defect | 3 | 0 |
| Completion claimed but never performed | 0 | 10 |
| Safety violation | 0 | 5 |
System A needs better recall, argument validation, and three benchmark repairs. System B claims work it did not do and violates policy in a quarter of its failures, which is a deployment question rather than a modeling one. The score they share tells you none of it.
I closed a post on eval harnesses with one sentence about this: when something fails, categorize it (wrong plan, wrong tool arguments, retrieval miss, premature stop, hallucinated completion, grader bug), because a score says something changed and the taxonomy says what to fix. That line deserves more than a sentence, and it generalizes past LLM agents to any system that turns information into a decision.
Why an aggregate score moves
Any aggregate metric is a mixture over failure modes:
where indexes buckets. Both factors move independently, so a headline number can shift because the system changed within a bucket, because the case mix shifted, because a failure mode appeared that did not exist last release, because the evaluator changed, or because the evaluated population changed.
All five look identical in the metric. Without decomposition they are confounded, and whatever the team does next is a guess dressed as a decision. Two points off a pass rate can be a real regression in one bucket, a stable system meeting harder traffic, or a grader that started rejecting a valid output format it used to accept.
The evaluated object is the whole system
The convention in ML writing is . A deployed system is longer than that. It assembles context, predicts, applies a decision policy, selects an action, executes it, observes an outcome, and feeds part of that outcome back as future training data. A failure can enter at every transition, and exactly one of those transitions is the model.
The empirical record is blunt about this. Google’s ML Test Score rubric scores production readiness against 28 checks spread across data, model, infrastructure, and monitoring, on the premise that accuracy does not describe whether a system is ready to run. A Microsoft study of 4,960 deep learning job failures on a production platform found that 48.0% occurred in the interaction with the platform rather than in the execution of the code logic.
So “the model was wrong” is one hypothesis among many, and frequently not the leading one. A taxonomy whose only categories describe model quality will route every failure to a retraining ticket, which is how teams spend a quarter improving a model that was never the bottleneck.
Structured decomposition changes what people find
CheckList supplements held-out accuracy with a grid of linguistic capabilities crossed with behavioral test types. In one of its user studies, NLP practitioners given that structure created twice as many tests and found almost three times as many bugs as practitioners working without it. The structure changed what they thought to look for.
Slicing approaches the same problem from the other direction. Slice Finder searches for interpretable subsets where a model underperforms, on the premise that aggregate performance conceals subgroup failure. Domino extends that to unstructured data and reports an honest ceiling: 36% of the 1,235 slices in its own evaluation framework, a 12-percentage-point improvement over prior methods and nowhere near exhaustive.
A taxonomy tests the failure modes you already know about; slice discovery and unstructured trace reading surface the ones it does not contain yet. You need both, and you need to know which one you are doing. Keeping an explicit unclassified bucket and watching its share over time is the cheapest way to notice the second kind arriving.
Where a failure started and where it showed up
Consider a support agent asked to process a refund. The retriever misses the applicable policy. The planner, working from what it has, builds a plan the policy forbids. The tool call goes out with prohibited arguments. Nothing checks the result, and the agent reports the refund as issued. One trajectory, four places you could point at.
A flat list forces a bad choice here: count four failures and inflate every bucket, or count one and pick arbitrarily. Annotate causal roles instead.
- Primary: the first divergence you could have acted on. Here, context retrieval.
- Contributing: made the trajectory worse without being first. Here, planning.
- Recovery failure: could have caught the earlier mistake and did not. Here, verification.
- Terminal manifestation: what the user actually saw. Here, a false completion claim.
The distinction decides what gets fixed. In BrewTrace’s
25-case eval, two of the five qwen3-8B failures had the agent giving the correct advice in prose
(“use more coffee”) while structured extraction mapped it to ratio/increase, which means the
opposite. Bucketed by symptom, those are bad recommendations and the model looks weak. Bucketed
by first failure, they are one schema mapping defect sitting outside the model entirely, and the
fix belongs in the extraction layer.
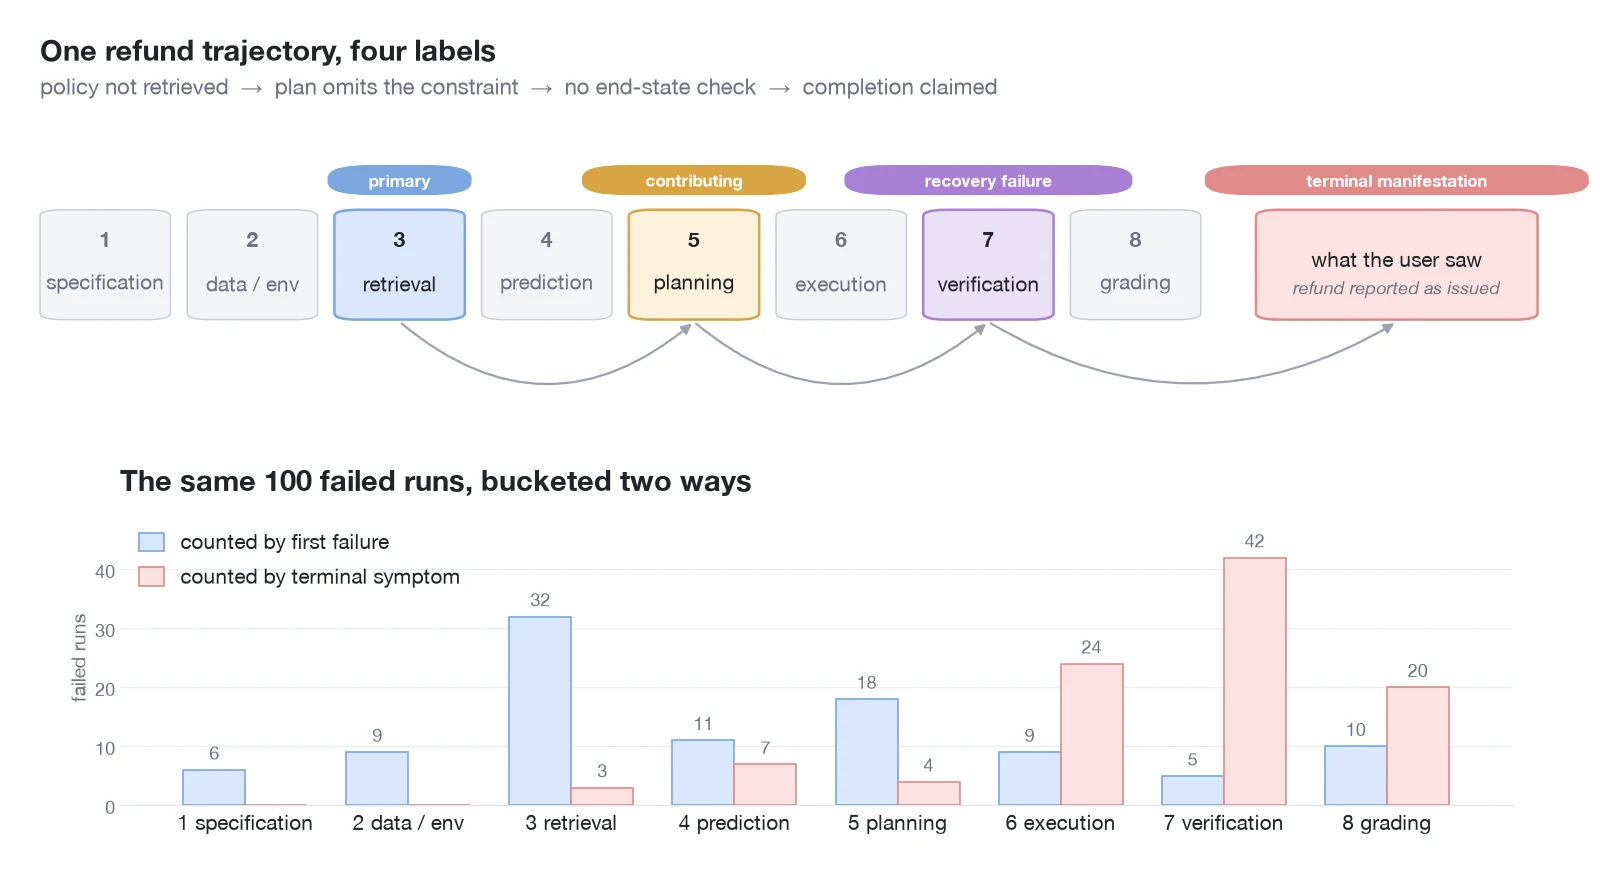
One trajectory carries several labels with different causal roles. Below, the same 100 failed runs counted two ways: by the symptom the user saw, and by the stage where the trajectory first diverged. Counts are illustrative, but the disagreement between the two views is the normal case whenever failures cascade.
Recording this takes a small structured record per failed run rather than a labeling program:
run_id: run-18492
outcome: { passed: false, severity: high }
primary_failure: { stage: context_retrieval, detail: applicable_policy_not_retrieved }
contributing: [{ stage: planning, detail: constraint_omitted }]
recovery_failure: { stage: verification, detail: no_end_state_check }
terminal_manifestation: { symptom: completion_claimed }
evidence: { first_bad_step: 6, trace_spans: [5, 6, 9, 10] }
routing: { owner: retrieval, regression_case: refund-policy-017 }
taxonomy_version: 1.2
An eight-stage taxonomy
The six buckets from the original line are a fine checklist and a poor taxonomy, because they mix stages, symptoms, and measurement artifacts at one level. Here they are placed in a stage axis that covers the rest of the system, with the original six in bold:
| Stage | What went wrong | Usual owner |
|---|---|---|
| 1. Specification and ground truth | The task was ambiguous, self-contradictory, or ungradable | Product, labeling |
| 2. Data and environment | Information missing, stale, or malformed; the platform interfered | Data, platform |
| 3. Context and retrieval | Available information was not found, ranked, or kept in context | Retrieval |
| 4. Prediction and inference | The model misestimated a value, class, probability, or latent state | Modeling |
| 5. Planning and decision policy | Adequate information, poor objective, threshold, or action sequence | Policy, planning |
| 6. Action and execution | The chosen action did not become a valid, completed operation | Tools, platform |
| 7. Verification and termination | The result went unchecked, or the run stopped at the wrong moment | Orchestration |
| 8. Measurement and grading | The harness, grader, fixture, or reference answer was wrong | Eval owners |
Retrieval miss is stage 3. Wrong plan is stage 5. Wrong tool arguments is stage 6. Premature stop and hallucinated completion are both stage 7, which is worth noticing: they are opposite symptoms of the same missing verification step. Grader bug is stage 8.
Eight is a deliberate ceiling. Empirically built taxonomies converge on a small top level and push detail underneath: the ICSE 2020 taxonomy of real faults in deep learning systems organizes 92 leaf fault types under 5 top-level categories, and MAST, built from 150 annotated multi-agent traces, organizes 14 failure modes under 3. A hundred-category scheme looks thorough and produces sparse counts nobody can act on.
Split leaves rather than the top level, and split by domain. A coding agent divides stage 6 into command construction, patch application, and test interpretation. A hardware repair decision system divides it into parts availability, dispatch, and confirmation that the repair held.
Count failures per opportunity
Denominators decide what your dashboard means. Invalid tool arguments belong over tool calls rather than over tasks. A release that calls tools twice as often can show more raw invalid calls while its per-call error rate is falling, and a per-task denominator will report that improvement as a regression.
Four measures carry most of the weight. The first-failure distribution shows where trajectories diverge, and it is the one that routes work. Recovery rate by stage shows how often the system catches its own intermediate errors, which is what lets a system tolerate upstream noise. A rising unclassified share means the taxonomy is drifting away from reality. Severity- and reversibility-weighted burden keeps a frequent formatting defect from outranking a rare irreversible action.
Resist compressing these into one priority score. Weighted averages let a cheap, fast, unsafe candidate look acceptable, which is the same argument for keeping invariant violations as gates.
Audit the grader as hard as the system
Stage 8 deserves its own discipline, because the measurement apparatus fails in every way the system does and its failures are invisible in the score by construction. A 2025 audit of agentic benchmarks found task setup and reward design defects causing “under- or overestimation of agents’ performance by up to 100% in relative terms.” The examples are specific: τ-bench counted empty responses as successful, and SWE-bench Verified shipped tests too weak to catch wrong patches. Applying the paper’s Agentic Benchmark Checklist to CVE-Bench cut the measured overestimation by 33%.
This shows up directly in a failure table. Some fraction of the rows are measurement artifacts, and repairing them changes the reported score while the system stays exactly as it was. If you have never found one, the likely explanation is that nobody looked. Anthropic’s guide to agent evals gives one blunt heuristic in the same spirit: with a frontier model, a 0% pass rate across many trials is most often a broken task rather than an incapable agent.
Treat the grader as a versioned component with reference solutions, a known false-negative rate on serious violations, and a periodic human audit sample. NIST’s AI Risk Management Framework asks the same at the governance level: MEASURE 1.2 requires that metric appropriateness and control effectiveness be “regularly assessed and updated.”
From bucket to fix
A bucket earns its place by changing what someone does. Each of the original six maps to a different intervention and a different metric that should respond if the diagnosis was right:
| Bucket | Likely intervention | Metric that should move |
|---|---|---|
| Retrieval miss | Query rewriting, index repair, reranking | Recall at k on a labeled retrieval set |
| Wrong plan | Change decomposition or the decision objective | First-failure share at stage 5 |
| Wrong tool arguments | Typed schemas, constrained decoding, validators | Invalid calls per tool call |
| Premature stop | Explicit termination criteria, progress checks, escalation | Recovery rate at stage 7 |
| Hallucinated completion | Deterministic end-state verification | Claimed versus verified completions |
| Grader bug | Reference solutions, audit passes as well as failures | Measurement defects found per release |
The maturity test for any leaf you add: it names an owner, it points at the evidence in the trace that confirms it, it produces a regression case, and it predicts a metric. A category that fails all four is an observation rather than a bucket, and it belongs in the unclassified pile until someone can say what it would change.
One caution. A category records where a failure became visible and actionable, which is a different question from why it happened. Wrong tool arguments can come from undocumented schemas, a retrieved obsolete API version, context truncation, or a wrapper that silently renamed a field. The taxonomy narrows the investigation; the trace and a controlled change finish it.
What this looks like in my own projects
BrewTrace, a local tool-calling agent, tags every eval case with eval.case_id and eval.passed,
so a failed case becomes a trace query rather than a mystery. Its baseline 20/25 resolved into
three named buckets (the schema mapping described above, a second-choice adjustment, and guesses
where the rules ask for more data), each pointing at a different fix. A later sweep across five
local models that all advertise tool support produced pass rates from 88% to 0%, with four
distinct failure modes behind them. One ignores the tools. One calls them and discards their
answers. One reasons its way to an answer it never states.
APAB, the phased-array design agent, scores golden tasks against a run’s own audit bundle with a deliberately LLM-free scorer, which keeps stage 8 cheap to trust. planner-lab runs the complement at runtime: nine deterministic checks that refuse to emit any memo whose numbers fail to trace. That is a stage 7 gate catching stage 4 and stage 6 failures before a user sees them.
Start with the first failure
Keep the aggregate metric. It is a good detector and the right thing on a release dashboard. Then annotate the stage where each failed trajectory first diverged, separately from the symptom that made it visible, and normalize both by the opportunities that produced them. Preserve the trace behind every label, version the taxonomy as it changes, and audit the grader on the same schedule as the system.
Each step answers a question the previous one cannot. The score detects that something moved. The taxonomy routes it to an owner. The trace explains the mechanism. A controlled change confirms whether the diagnosis was right.
This is an independent analysis written on my own time, using the public sources cited above. The projects mentioned are independent work. The views are my own and do not represent any current or former employer.
Frequently asked questions
What is a failure taxonomy in machine learning?
A controlled vocabulary for categorizing why a system failed, applied to individual runs rather than to the aggregate. A useful one records the stage where the trajectory first diverged, the causal role of each label (primary, contributing, recovery failure, terminal manifestation), and the evidence in the trace that supports it.
What does an aggregate accuracy or pass rate leave out?
An aggregate metric is a mixture over failure modes, so it can move because the system changed within a bucket, because the case mix shifted, because a new failure mode appeared, because the evaluator changed, or because the population changed. All five look identical in the headline number.
How many categories should a failure taxonomy have?
Keep roughly eight stable top-level categories and push domain detail into leaves. Empirically built taxonomies converge on a small top level: the ICSE 2020 deep learning fault taxonomy has 5 top-level categories over 92 leaf fault types, and the MAST multi-agent taxonomy has 3 categories over 14 failure modes.
Should failure counts be normalized?
Yes, by opportunity rather than by run. Invalid tool arguments belong over tool calls rather than over tasks. A version that calls tools twice as often can show more raw invalid calls while its per-call error rate falls.
Can the grader itself be a failure category?
It should be. A 2025 audit of agentic benchmarks found task setup and reward design defects that shift measured performance by up to 100% in relative terms, including a benchmark that counted empty responses as successful. Repairing those changes the score without changing the system.
More in Machine learning
- Connect Four AI: the minimax algorithm behind Neon Drop · 2026-07-06
- Physics, learning, and control, in one helicopter simulator · 2026-07-06
- Predicting the next pitch, by decomposition · 2026-06-23